Lecture
note of GEO 381/550 September 14, 2004
The
purpose of this lecture is to introduce you to a variety of map projections and
let you cultivate a sense of choosing the right projection suited to the need.
How
many kinds of map projections?
Projection types[3]
* projection properties[3]* tangent[2] * aspect[3] …
|
|
Equal-area |
Conformal |
Equidistant |
|
Cylindrical |
|
|
|
|
Conic |
|
|
|
|
Azimuthal |
|
|
|
Most
popular choice for thematic mapping is equal-area because of the need for
representing the area true to scale. Always open for customizing maps to the
need (e.g. Navigational chart, proximity map, shortest
path, perspective view).
Cylindrical
projections
- Parallels
and meridians meet at the right angle; easy to construct à that’s
why it has been so popular
- The
spacing of either parallels or meridians varies depending on which quality
is to be preserved.
Mercator
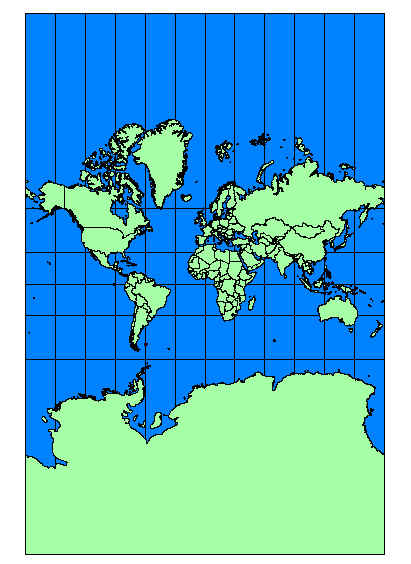
o
Extend the parallel spacing in the high latitude to make the
azimuth constant
o
Any straight line in Mercator maps
is a rhumb line (loxodrome)
o
Areal exaggeration
in high-latitude areas; In fact,
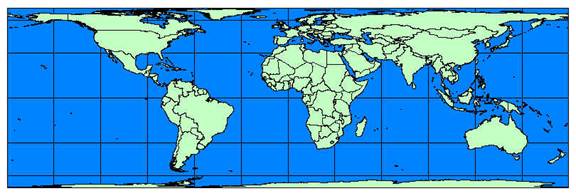
To
compensate for areal distortion, equal-area
cylindrical projections have been devised.
Standard line: 0°
Gall
Source: http://www.colorado.edu/geography/gcraft/notes/mapproj/gif/gall.gif
Standard parallels: 45°N, 45°S
Other aspects for cylindrical
family
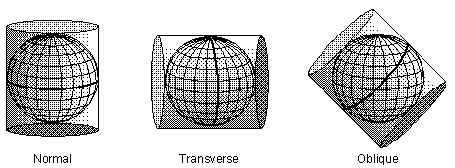
Transverse
Mercator
Standard line is central meridian
Adequate for portraying south-north extending
areas
Universal
Transverse Mercator (UTM)
Divide the world into 6 degree longitudinal strip,
and then project the globe into the strip where the center of the strip becomes
a standard line
Oblique
Mercator
Good for portraying diagonally extending areas
(e.g.
Equal-area pseudocylindrical projections
- Unlike
rectangular projections, it has rounded margin to correct for area with
less degree of shape distortion
- Widely
used for mapping world distributions
Sinusoidal
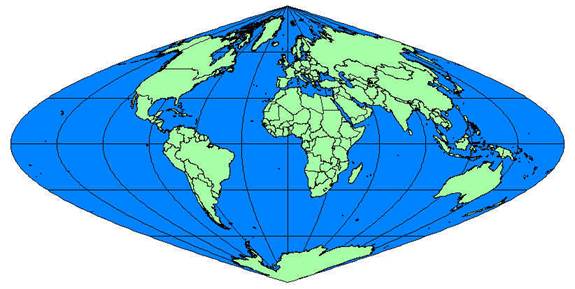
Horizontal parallels; sine curved
meridians; awkward shape
Mollweide
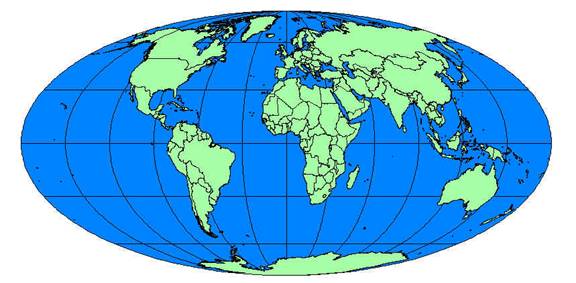
Horizontal parallels; elliptic
meridians; less distortion of shape than Sinusoidal
Hammer
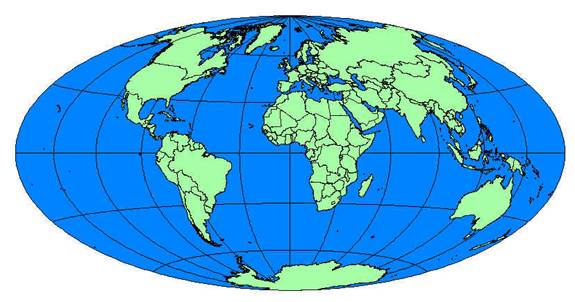
Curved parallels; elliptic meridians,
less distortion of shape than Mollweide
Conic projections
- Suitable for portraying
the area of large east-west extents in mid-latitude or high-latitude
- Flexible choice
of standard parallels
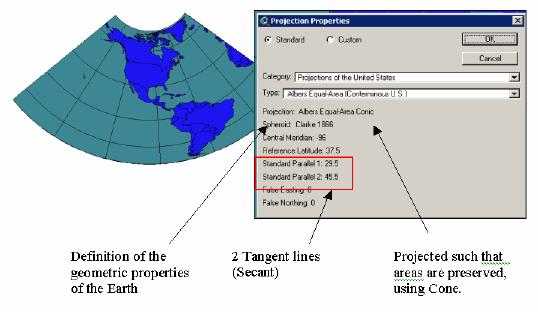
Albers
equal-area conic
Lambert
conformal conic
Azimuthal projections
- Gives the
directions or azimuths of all points on the map correctly with respect to
the center
- Azimuthal (true
direction) is not an exclusive quality (i.e. comes with other qualities
such as Equidistant Azimuthal, Equal-area Azimuthal, and Conformal Azimuthal)
- The
straight line from the central point to all other points is great circle
(it is so between any arbitrary points in gnomonic projections)
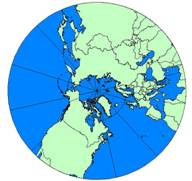
Polar
aspect
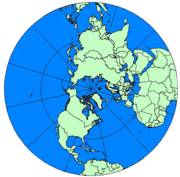
Equatorial
aspect
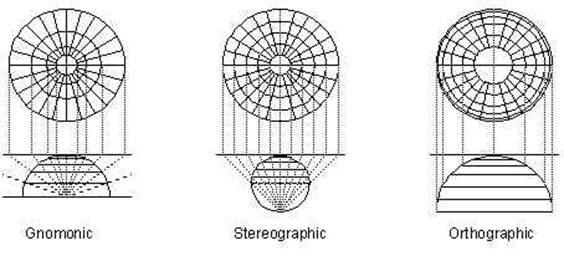
- Gnomonic:
straight line between any arbitrary points is great circle; why? the
location of light source; known for navigational charts for the air age in
particular during the world war
- Stereographic:
conformal
- Orthographic:
provides perspective view; neither equal-area nor conformal
Equidistant
Azimuthal
Shows every point on the globe at its
correct distance, and in its correct direction, from the center of the
projection
Good choice for portraying
proximity/direction to the center of map
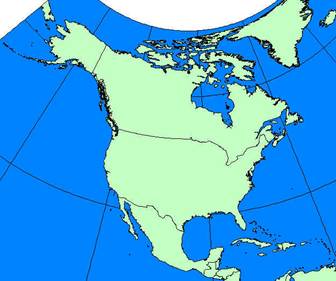
Lambert
Azimuthal Equal-Area
Well suited to mapping regions that do
not have any large difference between their north-south extent and their
east-west extent
Good choice for small-scale density or distributions
map
Criteria for the
employment of map projections (D3:49)
1.
Projection properties
2.
Deformation patterns
3.
Projection center
4.
Familiarity
5.
Cost
Guide to the
employment of projections for thematic maps in different scales
World
in the geographic grid


Mark Equator, Prime Meridian, and International
Dateline
Mark approximiate
longitude and latitude of the centroid of each
continent, or country
Table
3.1
1.
Maps of the world in one sheet
Mostly derivation of pseudocylindrical family (e.g. Sinusoidal, Mollweide, Hammer)
Mercator maps for
showing constant geographic direction
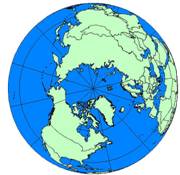
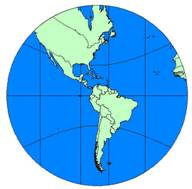
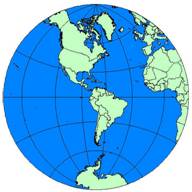
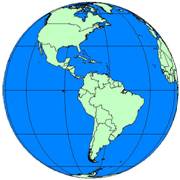
2.
Maps of the hemisphere
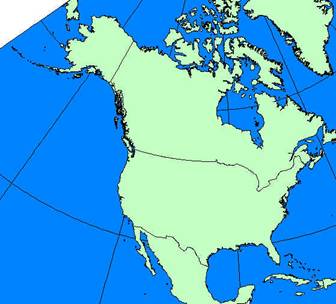
Orthographic: view of earth as if from
space; neither equal-area nor conformal
3.
Maps of the continent in the mid-latitude
Bonne: derivation of conic family
(Figure 3.3)
Albers equal-area with two standard parallels
Lambert equal-area azimuthal:
Demo in ArcView
*Make sure the location of the
continent to be mapped is centered due to the severe shape distortion edgeward
4.
Maps of the continent in the low-latitude
Sinusoidal, Mollweide,
Bonne
Lambert equal-area azimuthal
5.
Maps of US
Albers equal-area
Lambert conformal conic
Lambert equal-area azimuthal
Source: http://www.colorado.edu/geography/gcraft/notes/mapproj/gif/twoproj.gif
Coordinate
systems
Coordinate
systems can be seen broadly as two kinds: one is spherical (unprojected)
coordinate system (that is three dimensional) where latitude and longitude are
used to reference the location. The other is planar (projected) coordinate
system where 3 dimensional earth is transformed into 2
dimensional flat surface through projection.
Also
it is possible to divide coordinate systems into global versus local. Global
coordinate systems are used globally (so you can refer all regions in the world
using one system such as UTM). Local coordinate systems are designed to fit a
local region, so you can’t use them in other regions. (e.g.,
Global
Coordinate Systems
¨ Latitude Longitude (a.k.a
Geographic Coordinate System)
o
Unprojected (Projection
itself indicates the transformation from 3 dimensions to 2 dimension);
represents the location in the three dimensional surface by longitude and
latitude.
o
The Prime Meridian and the Equator are the reference planes
used to define latitude and longitude.
o
The latitude of a point is the angle from the equatorial
plane to the vertical direction of a line normal to the reference ellipsoid.
o
The longitude of a point is the angle between a reference
plane and a plane passing through the point, both planes being perpendicular to
the equatorial plane.
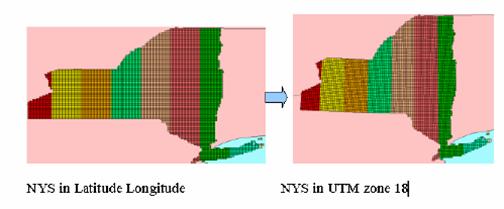
¨ Universal Transverse Mercator (UTM)
o
A kind of Transverse Cylindrical projection, but the
standard line varies with the regions in the world
o
UTM zone numbers designate 6 degree longitudinal strips
extending from 80 degrees South latitude to 84 degrees North latitude.
o
UTM zone characters designate 8 degree zones extending north
and south from the equator.
Source: http://www.colorado.edu/geography/gcraft/notes/coordsys/gif/utmzones.gif
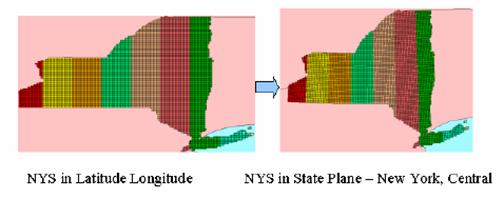
Local Coordinate Systems (
¨ State Plane Coordinates
o
divides all fifty of
the
o
Three projections are used: the Lambert Conformal Conic for
zones running east and west, the Transverse Mercator
for zones running north and south, and the Oblique Mercator
for one zone only, the panhandle of
o
developed in the 1930s
and was based on the North American Datum 1927 (NAD27). (NAD 27 coordinates are
based on the foot.)
o
The State Plane System 1983 is based on the North American
Datum 1983 (NAD83). (NAD 83 coordinates are based on the meter.)
Matching the
map projection to the need
|
|
Equal-area |
Conformal |
Equidistant |
|
Cylindrical |
A1 |
A2 |
A3 |
|
Pseudocylindrical |
B1 |
B2 |
B3 |
|
Conic |
C1 |
C2 |
C3 |
|
Azimuthal |
D1 |
D2 |
D3 |
- World
population density
- Agricultural
regions in
- World
navigational chart for mariners
- Navigational
chart for pilots
- World
ocean currents map
- Natural
resources in
- Proximity
map of
- Shaded
relief map of South Pole
- Road map
of
Setting Map Projections in ArcView
When
publishing geographic data, they usually come with metadata where spatial
reference information is defined to which you can refer. Metadata defines
coordinate system, projection (e.g., unprojected,
UTM), map units (e.g., decimal degree, meters), and geodetic model (e.g. datum,
spheroid) in the Spatial_Reference_Information item.
Example of Geographic coordinate system: (TIGER 2000)
Example of UTM: (NY Aquifer from NYDOH)
Example of
Lambert Azimuthal Equal Area: (USNationalAtlas)
The
most common form of the spatial reference is the latitude and longitude. When
you add themes that are stored in geographic coordinate system, ArcView View shows the coordinates of the point you are
pointing at. Just look at cursor location while you are moving around the
cursor in the view area when a theme is added.
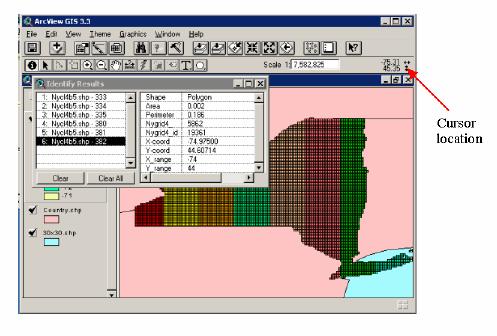
Decimal
degree shown in the cursor location (i.e., degrees of longitude-latitude
expressed as a decimal rather than in degrees, minutes and seconds) indicates
the data is stored in the Latitude Longitude.
Choose
Properties from the View menu, the Projection should be set to None because it is the unprojected
coordinate system. Map units should be decimal degree. Map units are the units
of the view’s display surface. For example, the data stored in UTM, the map
units should be in meters as defined in the coordinate system.
In ArcView. a view's map projection can only be set if the map units of
the spatial data it contains are decimal degrees. In ArcView, you can
choose the appropriate projections and play with them as long as the data is in
decimal degree.
Display
countries in different projections
a.
In a View, Add country and world30
from c:\esri\ESRIDATA\World\ by clicking ![]()
b.
In case world30 covers country,
hold down the world30 to the bottom in the Table of Contents
c.
Choose Properties… from the
View menu
d.
Click Projection… button
e.
Make sure Standard option box
is checked on the top
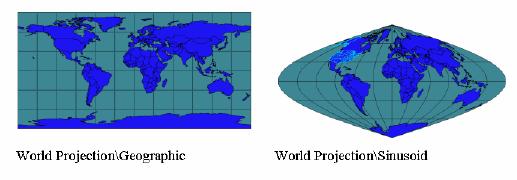
f-1. Select “Projections of the
World” for Category field, and select “Geographic” for Type field
f-2. Select “Projections of the
World” for Category field, and select “Sinusoid” for Type field
Display
f-3. Select “Projections of the
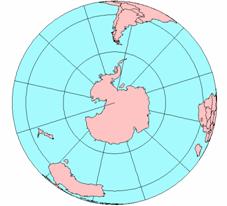
Display South Pole in right
projections
f-4. Select “Projections of a Hemisphere” for Category field, and select
“Orthographic – South Pole” for Type field
Display
f-5. Select “State Plane - 1983” for Category field, and select “
f-6. Select “UTM - 1983” for Category field, and select “Zone 18” for Type
field
As you see from the map above,
the local coordinate system is designed to minimize the distortion in the area
of your interest. You should not use the local coordinate system for displaying
larger area.
When your spatial data is not
in decimal degrees, and you are using data from a variety of different data
sources on the same view, you should make sure that all these data sources are
currently stored in the same map projection. If you draw data sources that are
currently stored in different map projections on the same view you may get
errors and inaccurate results.