GEO381/550
Lecture note of October 28th 2004 Choropleth
Map
What is choropleth mapping?
Choros+pleth = area +
value
Mapping techniques which symbolize
values applied to area
Often called enumeration mapping b/c
values are shaded in enumeration units
The most common way to map areal aggregated data
In most cases, the data is classified
Dates back to the early 1800s
Continuous value within enumeration
units; separated by abrupt boundaries
Choropleth map defined: A
method of cartographic representation which employs distinctive shading applied
to areas other than those bounded by isolines. These
are usually statistical or administrative areas. (Dent)
Data model
concept in choropleth mapping
Best
way of understanding the data model concept in choropleth
mapping is to visualize a prism map.
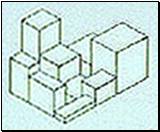 à
à 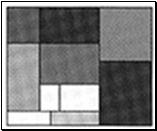
Prism map Choropleth
map)
or Figure 7.2
or Figure 7.1
Each enumeration unit is a prism raised
vertically in proportion to the value it represents
The higher prisms are normally represented
by darker shade
The lower prisms are normally represented
by lighter shade
Q.
Suppose you have to make a map using the following data. Decide whether to use
the choropleth map.
(1)
Temperature records at stations
(2)
Infant death rate by county
(3)
Total population by census tract
(4)
Average persons per household unit by census tract
(5)
Sex ratio by county subdivision
(6)
Number of hospital beds by county
(7)
Average SAT scores by school district
(8)
Net sales growth rate of shopping malls
When to use choropleth maps
I.
Phenomenon
II.
Data
In
the real world, data is not available in a manner that is consistent with the
phenomenon
- Crime
occurs at an individual level, but the aggregated value of crime is
reported in the unit of jurisdictions
- Income
occurs at an individual level, but the aggregated value of income (e.g. average
income) is reported in a certain level of the census geography (also for the
reason of confidentiality)
Guidelines for deciding whether to use a
choropleth map with regard to data:
o
Population
o
Population density
o
Median home value
o
Share of public transportation use
o
Per capita income
o
Crop yield per acre
Ø
Do not use choropleth map for data which has nothing to do with
enumeration units:
Choropleth maps are used
when data occur or can be attributed to definite enumeration units (e.g. The distribution of temperature is not controlled by
administrative boundaries)
Ø
Do not use choropleth map for total values:
In most cases, the enumeration units on
a map are unequal in area
Unequal size of enumeration units can
alter the impression of the distribution
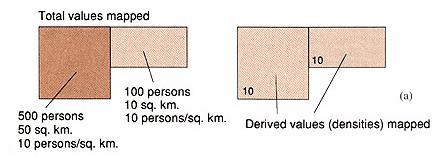
Mapping total values
on different sizes of units obscures fact that the densities are the same
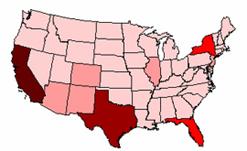
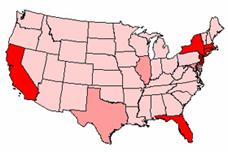
Total
Hispanic Population Hispanic
per square miles
Watch out for the
effect of large size of
Figure 7.4 (b)
Uniform
distributions will be obscured when totals alone are mapped
Ø
Do not use maps
if the interest is to show exact values:
This applies
to all other map types; Lists of value will do better for this.
Remember that a map is “abstracted
image” (cartographic abstraction): simplification, and
classification masks the details at the expense of structuring the message
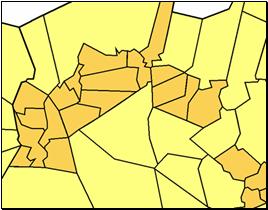
Limitations of
choropleth maps
- In most cases,
enumeration units have nothing to do with the distribution of data. That
is, enumeration units create artificial division of values
e.g. population
density map: does the map represent the reality?
Is it desirable to make the boundary of
enumeration units pronounced?
- Very
strong assumption is made in choropleth mapping:
the value in the enumeration unit is spread uniformly throughout the unit.
Figure 7.5
If the variable is changing within the
enumeration unit, the change cannot be detected on the choropleth
map
Any alternative?
Dasymetric mapping
 à
à 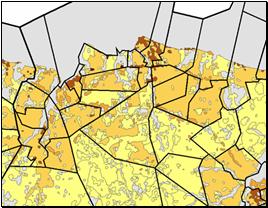
Choropleth map Dasymetric map
Source: Mennis, J, 2003, Generating surface models of population using dasymetric mapping, The Professional Geographer 55(1):
31-42
Dasymetric maps are a
variation of choropleth maps, also mapping
standardized, classified data using areal symbols.
The difference is that the mapped zones do not correspond to enumeration units,
but ancillary variables are used to change the boundaries of zones to better
represent the actual distribution of the data within zones.
Preliminary considerations
in choropleth mapping
Ø
Geographic phenomenon
o
Optimal measure of the map subject? (e.g. retail?)
o
Value is normalized by which attribute? (e.g. traffic crash aggregated by
enumeration units)
Ø
Number and kinds of areal units are determined by:
o
Map purpose
o
Map scale
o
Symbolization (in particular when you use pattern instead of tint)
- Qualitative
classification
Classifies nominal data
- Quantitative
classification
- Exogenous schemes:
set by external criteria
- Arbitrary schemes: set
by arbitrary schemes
- Ideographic schemes:
defined by data distribution
- Serial schemes:
statistically defined
Qualitative
classification
Quantitative classification
Unclassed choropleth map
Not
all of choropleth maps are classed:
Which
one do you think present the proportion of married couples better?
Unclassed map convey values more accurately than
classed maps
Unclassed map convey values less effectively than
classed maps
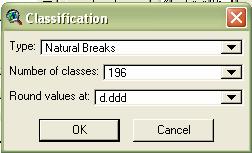
Demo
in ArcView:
Set the number of values to the number of classes
Designing choropleth maps
- Data classification
What is the best way of representing the
distribution of data while serving the map purpose?
§
Rectangular distribution
§
Normal distribution
§
Well-defined break
- Legend design
Continuous legend and classing designs Noncontinuous legend
and classing designs
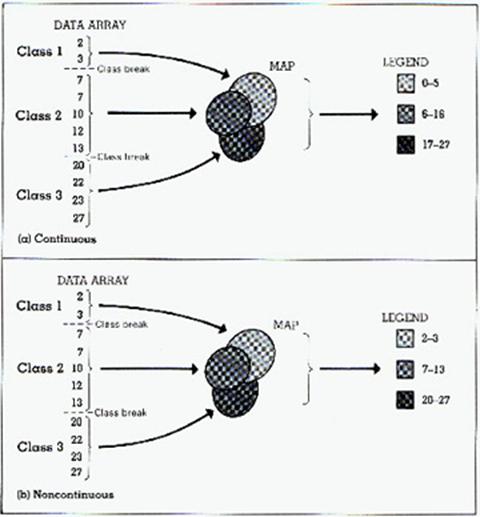
When
the class break is obvious, it is not desirable to assign continuous values in legend
designs
In
ArcView, you can type in value in the legend editor
But it’s tedious; alternatively, include a histogram of the data array
(Figure 7.15) or report descriptive statistics (mean and standard deviation)
- Areal symbolization
Recall visual variables used for areal symbols
There are two types of areal
symbols which
(1) Use pattern (2) Do not use pattern
(1) Pattern
a. Arrangement (dots, lines, hachures)
b. Texture (spacing between
elements)
c. Orientation (vertical,
horizontal, oblique)
(2) Color
a.
b. Value (gray tones): used
for a single variables
c. Saturation (gray tones)
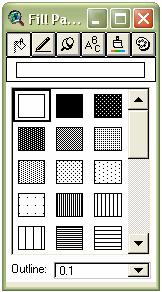
In ArcView
For pattern, use Fill Palette from the legend
editor
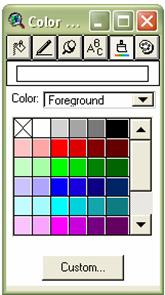
For color, sue Color Palette from the legend editor
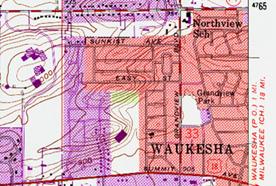
- Base-map design
Often neglected element of map design in choropleth mapping
Providing relevant background information can facilitate
map readings
Figure 7.18: see how choropleth
symbolization has been altered due to base-map material
- Several other
considerations
- Avoid the black and
dark hues
i.
Can mask base-map information as shown in Figure 7.18
ii.
Black obscures black boundary symbols
iii.
White may be interpreted as no data
- Always use
equal-area maps (map projection property)
- Accommodate
overprinting for printout
i.
It may come out darker than the actual tone
Census Geography of the
p.
82 (Figure 4.8)
TIGER/Line
website
Next
class: proportional symbol map (READ CHAPTER 9)