Geog 258: Maps and GIS
January 25, 2006
Relief Interpretation
Reading: Chapter 16 (Slope
and profiles)
Using relief maps, you can
answer many questions:
How steep is this route? →
slope
Where is the steepest route? → gradient path
Find house with a good view →
intervisibility (viewshed
analysis)
Profiles of landform along given
path → profiles
Slope
What is slope?
Difference in elevations between
two points
Three ways to measure slope:
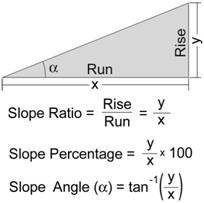
Tan(α) = y/x
α (in radian) = inverse tangent (y/x)
To convert radian to degree, multiply
the value by 180/pi degree (because one radian is 180/pi)
Exercise
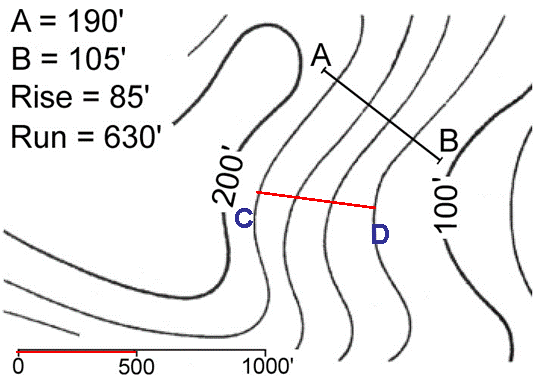
(1)
What is contour
interval?
(2)
What is run
(horizontal distance) between C and D?
(3)
What is rise (elevation
difference) between C and D?
(4)
What is scale
ratio?
(5)
What is scale
percentage?
(6)
What is slope
angle in degree?
(7)
What would be the
walking distance between C and D assuming that the slope is linear?
where inverse tangent of scale ratio is approximately 0.12
Gradient
Maximum slope at a point
If you drop water in terrain
at one point, you would probably want to know how fast it would fall and where
it flows. The first information can be derived from gradient magnitude
(how steep) and the second information refers to gradient azimuth (direction,
or more precisely defined angular distance from a reference direction)
1) Gradient magnitude
Suppose you want to gradient magnitude
at point (i,j), and
elevation in neighboring cells would look like below:
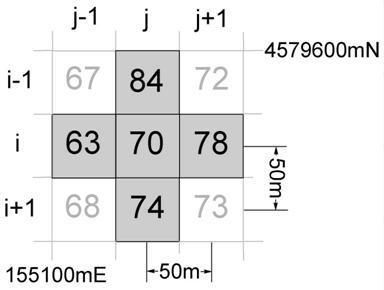
To obtain average slope at (i,j) at x-direction, get two slopes (one from j+1 to j, and the other from j to j-1) and
calculate the average of them
Slope from j+1 to j: rise/run
= (78-70)/50 = 0.16
Slope from j to j-1: rise/run
= (70-63)/50 = 0.14
Average of two slopes at
x-direction = (0.16+0.14)/2 = 0.15
Similarly, to obtain average
slope at (i,j) at
y-direction, get two slopes (one from i-1 to i
Slope from i-1 to i: rise/run = (84-70)/50 = 0.28
Slope from i to i+1: rise/run = (70-74)/50 = -0.08
?
Average of two slopes at
y-direction = (0.28-0.08)/2 = 0.1

![]()
![]()
Gradient magnitude = sqrt (0.15^2 + 0.1^2) = 0.18
where sqrt is square root, ^
means power
2) Gradient azimuth
Tan (α) = 0.1/0.15
α = atan
(0.1/0.15) = 0.588 in radian
where atan is inverse tangent
α is 33.69 º (=0.588*180/pi)
Gradient azimuth is
180-(90+33.69) = 56 º
Therefore, from the example
above, it can be said that the terrain is
18% uphill at 56 degree
azimuth from grid north or
18% downhill at a (56+180)
degree azimuth from grid north
Finding
constant slope paths
The following figure
illustrates how to draw constant slope paths.
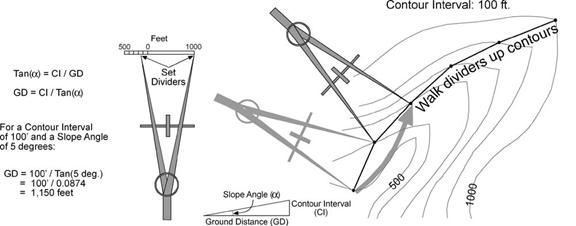
Slope = rise/run
Slope can be made constant by
making rise and run constant
Rise is constant between two
neighboring contour lines (contour interval is constant)
Run can be made constant by keeping
the same ground distance with divider
How much (ground distance) should
be set to divider for 10 degree slope path?
where tan (10 degree) is approximately 0.176
Profiles
Surface viewed from the side
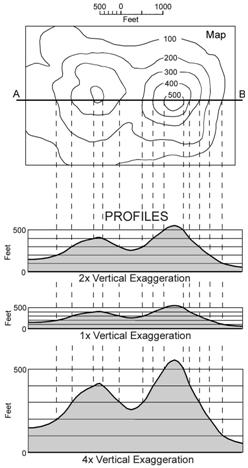
Steps for constructing a profile
from contour maps
1) Draw a straight line (=profile line) on the map
between the points of interest (line AB on the map)
2) Determine range of elevation in the map and set this
to the range of y-axis of profiles (0 to 500) with the same interval as contour
interval (100); x-dimension of map is set to x-axis of profile
3) Mark the points (x, y) in profiles by drawing vertical
line (Dashed line) from the tangent point between profile lines and contour
lines on the map. Do this for all tangent points
4) Draw a smooth curve between points in profiles marked
above
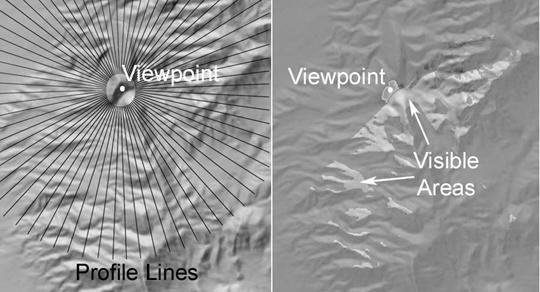
Intervisibility
From profiles, you can derive
features visible from a given vantage point. See Figure 16.14
You can determine intervisibility on the profile this way,
1) Plot your view point
2) Draw lines from the viewpoint that are tangent to the
profile
3) Label the visible and hidden portions of the profile
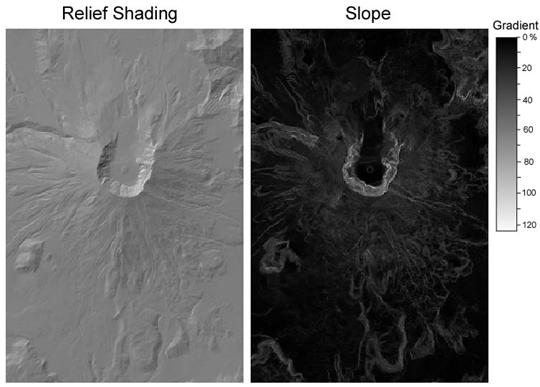
DEM, GIS,
and Terrain Analysis
GIS provides functionalities
for measurements of terrain features. Such measurement can be made over DEM
(digital data that stores elevation value in grid format).
Slope map: calculates gradient
magnitude for each cell. From this map, can you approximate how steep (in
degree) is in the crater area?
Visibility map is also referred
to as viewshed analysis.
GIS can calculate least-cost
path, slope, aspect and visibility from DEM.
Review
questions
·
How is gradient
different from slope?
·
How would be gradient
path used in real world? Give examples
·
(What about slope,
visibility, and profile?)
·
Why is road in
steep slope zigzagging? Can you explain this using the element of slope
measurement?
·
Can you make
precise measurement of slope from shaded relief map (like the one shown above)?