Geog 258: Maps and GIS
January 9 (Mon)
Fundamentals of geographic
data
1. Nature of environments
mapped
2. Level of measurements of
attribute
Nature
of environments mapped
Why study the nature of environments?

Because maps portray
environments! Environments are too complex to grasp without forcing them into
human constructs. For example, we identify location of features in latitude and
longitude (Cartesian coordinate), and group the world into regions to make
sense out of them. Human conception of environments (or nature of environments)
precedes mapping, and influences mapping process.
These are some useful
distinctions in human conceptions of the environment mapped
1) Type of features: Discrete/Continuous
2) Dimensionality of features: point, line, area
3) Tangibility of features: Physical/Abstract
4) Treatment of temporal elements in features: Form/Process
5) Three component of features: Space-Time-Attribute
In the followings, I will use
the term “feature” to refer to something portrayed on maps.
Type of features: Discrete/Continuous
If you have to make a map of
land parcel and a map of elevation, how would they differ in map-making
process?
You would probably have to
record the location of land parcel using GPS or surveying equipment. What about
the map of elevation? How different are they?
Some feature is discrete
(such as land parcel, road, building, and so on) while other feature is
continuous (such as temperature, elevation, air pressure, toxic level, ozone
level, and so on). In the case of continuous phenomenon, it is necessary to
devise sampling scheme. Temperature is measured in station (not all locations)
and compiled to create weather map for example.
It has an implication for GIS
data → dichotomy between vector and raster data
How discrete object is stored
in a computer; vector data

How continuous field is
stored in a computer; raster data

The division between discrete
and continuous feature is not necessarily clear-cut. Soil map usually portray
the discrete boundary of different soil types, but boundaries between different
soil types would be better described as transition zone instead of discrete
line.
It’s sometimes the outcome of
human conception; human prefers to discretize concepts.
Humans do not seem to be comfortable with being fuzzy. Actually it reflects limitations
of human cognition (i.e. short-term memory).
Dimensionality of features (types of symbols)
Look at this map. Tell me how
cities and roads are portrayed in this map in terms of familiar geometry
(point, line, area).
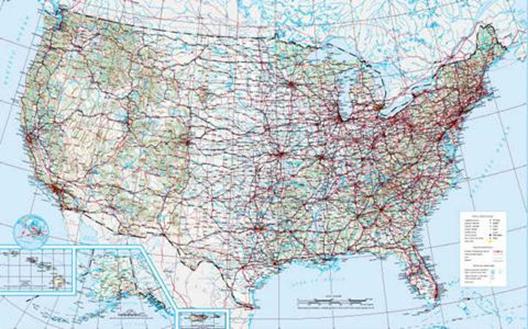
City is portrayed as point
Road is portrayed as line
Great lake is portrayed as
area
Geometric (dimensional)
Point: zero-dimensional
Line: one-dimensional
Area: two-dimensional
Volume: three-dimensional
Advantage of this conception
is in utilizing Euclidean geometry as well as set theory
Every location can be
represented as x, y coordinates in this Cartesian
coordinate
Area (lake) is a closed loop
of constituting lines; line (road) is a set of nodes
Any limit?
1) One
geometry doesn’t fit all. For
example, lake can be portrayed as point for identifying location, line for
hikers, and area for those interested in the extent of lake
2) The edge of features
mapped may not be necessarily crisp as it seems in the map (e.g. lake boundary, forest boundary, soil boundary, world region,
climate region)
Tangibility of features: Physical/Abstract
What is the difference
between land/ocean boundaries and country boundaries?
Border between Northwestern
U.S. and

Ocean and land boundary is
tangible (physical presence) while national boundary is not tangible
(artificial constructs).
Physical versus Abstract
Physical feature: lake, fault
line, mountain (physically existent)
Abstract feature: property
line, zone of influence (outcome of human demarcation)
Temporality of features: Form/Process
We easily forget about
temporal elements of features shown in the map. Most of maps (like paper map)
show the static status of features (i.e. time-stamped map). The map below
(cropland harvested) is made on the basis of 1949 data. So it may look quite
differently as of today (maybe much less due to the expansion of urban lands)
Cropland harvested

This map shows how cropland
harvested are distributed across
Demographic trends

This map shows how
demographics have changed over different period of time (1985 to 2000 in 5
years interval).
Form versus Process
Form: means spatial
arrangement of features, that is its shape, dimension, density, and pattern; it’s
about how it looks; subject of map analysis (e.g. measuring distance,
direction, finding route, identifying spatial pattern of disease, and so on)
Process: often has strong temporal
elements in addition to form; it’s about how it works; often requires the
understanding of principles behind the phenomenon; often subject of map
interpretation (e.g. the relationship between interstate highway and job
accessibility)
Technology changes the way
maps are produced in this regard: e.g. Animated map, web-based mapping, and real-time
mapping (e.g. traffic update) → more on this later
Space-Time-Attribute: three components of geographic
data
If I ask what kind of
information is portrayed in this map, how would you answer that?

Map portrays the potential to
movement to job opportunities (calculated on spatial interaction model; data
source: 2000 Census)
We are not well conscious of
components of geographic data other than attribute.
But all geographic data have
three components, which are
What (attribute)
Where (space)
Where (time)
Features portrayed on the map
above have three components. Space component is
Reference systems (how it is
measured) of three components used are respectively city for space, Christian
calendar for time, and some numerical value for attribute → More on
measurement scale of attribute in the next
Level
of measurements
Measurement scale (or level)
of attribute can be broadly divided into two categories. Some attribute are
measured in a numerical scale (such as job accessibility) whereas others are
not (such as world language)
Distribution of Indian tribes
& language

Source: National Atlas of
This map can be fallen into
qualitative thematic map because the measurement level of attribute portrayed
(tribe/language) is nominal (not measured in number), and displays one or more
particular themes.
Distribution of urban and rural
population

Source: National Atlas of
This map can be fallen into
quantitative thematic map because the measurement level of attributed portrayed
(population) is countable (measure in number), and displays one particular
theme.
More specifically, measurement of attributes is
organized into four levels: nominal, ordinal, interval, and ratio, listed in
increasing order of sophistication of measurement
Nominal
scaling
Only has a value either 0 or
1 (false or true)
Suppose we have two values
say region A and region B; we can’t determine if A > B or A < B, but we
can determine if A=\=B or A = B.
e.g. agricultural region (corn regions, wheat regions,
soy-bean regions)
political party affiliation (Democrat, Republican, Independent)
Sex (male, female)
Response (yes, no)

Ordinal
scaling
Value is arranged in a
hierarchy of rank
Can determine if A > B or
A < B, but can’t determine how much they are different
e.g. social power (more, less)
agreement (strongly agree, strongly disagree)
Order of arrival of contestants in footrace
Women's race Men's race
First
Jane Tom
Second
Melissa Dick
Third
Leila Harry
...
Interval
scaling
Ranked
Know the distance between
ranks
But it is not measured in an
absolute scale; they are relative (has no natural origin)
e.g. Fahrenheit

Ratio
scaling
Ranked
Know the distance between
ranks
It is measured in an absolute
scale (has a natural origin)
e.g. weight, elevation
convey
more information and permit more analytical treatment

Level of measurement prescribe the information
required for an attribute reference system
|
Level of measurement |
Information required |
|
Nominal |
Definitions of categories |
|
Ordinal |
Definitions of categories plus ordering |
|
Interval |
Unit of measure plus zero point |
|
Ratio |
Unit of measure |