1.Introduction to GIS
1. 1 What it is?
1.2 What
it does?
1.5 How
it works?
1. Introduction to GIS
An information system that is designed to work with geographically referenced data (or geospatial data)
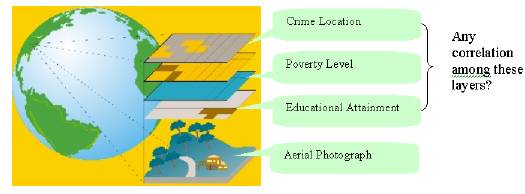
¨ GIS organizes the information about place by layers
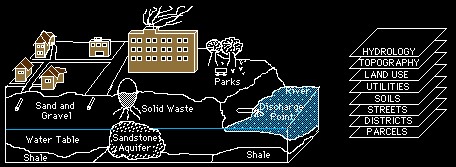
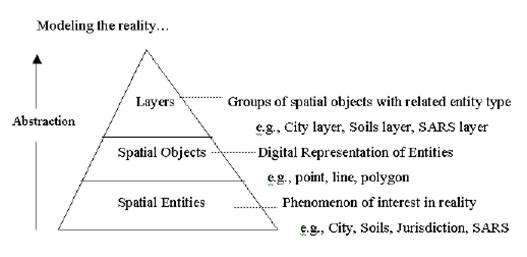
Any phenomenon can be represented as a layer since all things occur in a certain location and in a certain point of time. To put the world into the computer, we need an abstraction process that transforms real-world entities into mathematically manageable objects. We use basic shapes such as point, line and polygon to effectively capture the spatial components. Spatial objects contain the information about location such as latitude and longitude, as well as topology.
¨ In GIS, spatial objects are linked to attributes
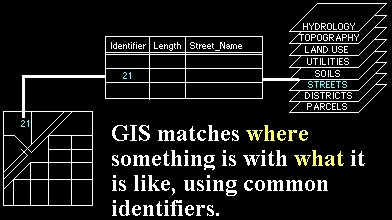
Each spatial object is associated with its attributes. For example, a road has descriptive information such as the number of lane, traffic flow, management agency, and pavement condition, as well as the spatial components. By linking spatial objects to attributes, we can have a better understanding of themes in hand. GIS organizes information such that it pivots around spatial components.
# A system for capturing, storing, retrieving, manipulating, analyzing, and displaying data which are spatially referenced to the Earth -- Chorley, 1987
# A database system with specific capabilities for spatially-referenced data, as well as a set of operations for working [analysis] with the data -- Start and Estes, 1990
# Components
of GIS: software, hardware, data, people, training (ESRI)
# GIS as a multidisciplinary science: GIS is an integrated multidisciplinary science consisting of the following traditional disciplines.
|
Geography |
Mathematics |
Remote Sensing |
|
Cartography |
Surveying |
Statistics |
|
Computer Science |
Geodesy |
Operations Research |
Estimates are that 80% of all data has a spatial component. Data from most sciences can be analyzed “spatially”.
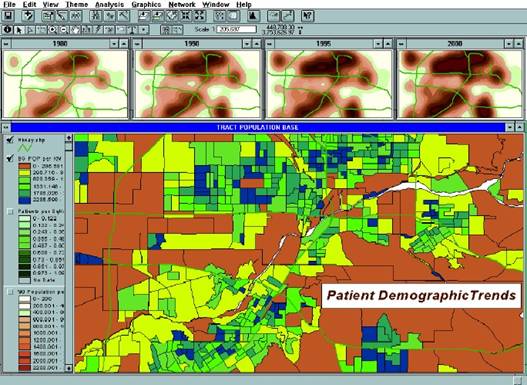
If what you do involves managing information, and that information can be linked to geographic locations, then GIS can help you organize that information in new ways so that you can make new discoveries and get more out of the information you have.
¨ GIS requires the following functionalities

-
Desktop
GIS lets you create map displays and maps for presentation simply by pointing
and clicking. Desktop GIS lets you visualize and analyze information in new
ways, revealing previously hidden relationships, patterns, and trends.
Archaeology, agriculture, banking, defense and intelligence, electric and gas, engineering- pipeline, engineering- surveying, federal government, fire/EMS/disaster/homeland security, forestry, health and human services, insurance, education, landscape architecture, law enforcement and criminal justice, libraries and museums, location service, marine/cost/oceans, media, mining/earth science, natural resources, petroleum, real estate, retail business, state and local government, telecommunications, transportation, universities, and water/wasterwater
“The application of GIS is only limited by the imagination of those who use it.” --Jack Dangermond, ESRI founder
Network
solutions
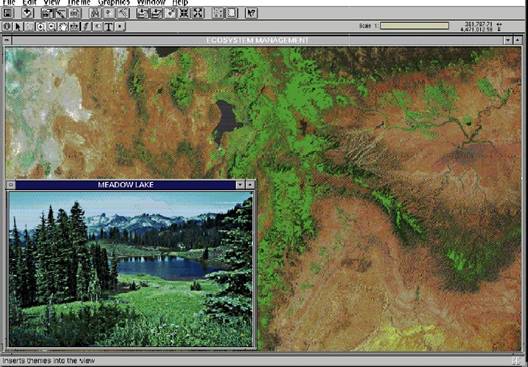
Ecosystem
management
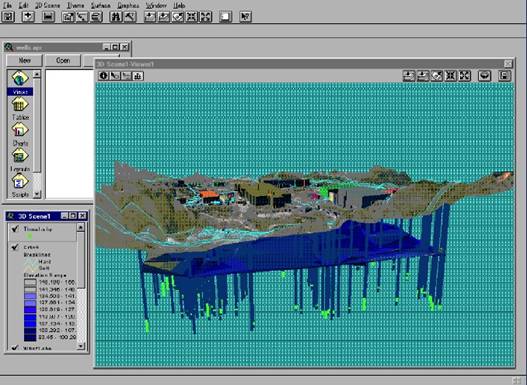
3D mine with
well data
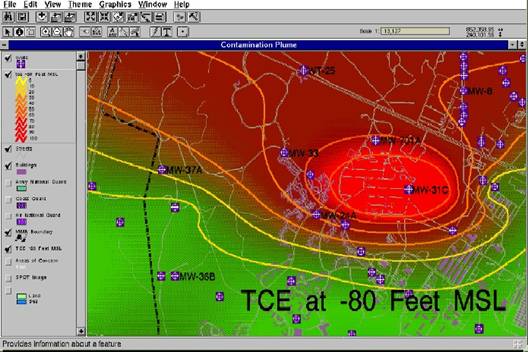
Environmental
monitoring toxic plume
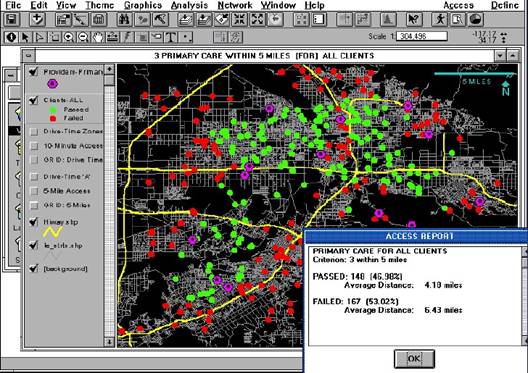
Site location
and client distance
Modeling of
future trends
# Integration:
Most problems facing the world today – environmental, economic, political, or
social – exist in a geographic context. GIS puts various themes all together.
Besides, GIS does not restrict data format – it allows you to work on feature
data (e.g., shapefiles), image data (e.g., satellite image), and tabular data
altogether.
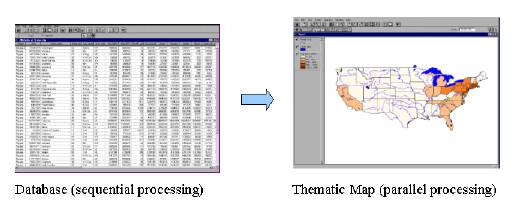
# Visualization:
Descriptive attributes may not be easy to interpret. On the contrary, maps are
worth a thousand words. GIS is an effective means of communications.
1.5 How it works? [Term
definition for ArcView]
# Map Features
The
objects represented on maps, whether natural or man-made, are called map
features, or simply features. Each map feature has a location, a
representative shape, and a symbol that represents one or more of its
characteristics. We call the relationships between feature locations spatial
relationships, which are important because understanding them helps us
solve problems.
To
represent real-world entities, maps use three basic shapes – points, lines, and
areas (commonly referred to as points, lines, and polygons in a GIS). Any
objects can be represented using one of these shapes. We call these shapes feature
types.
- Points (e.g., Schools, train stations, fire
stations, and buildings in small scale)
- Lines (e.g.,
Highways, railroads, bridges, and creeks)
- Polygons (e.g., Parks, lake, and
buildings in large scale)
The
scale of a map tells how the size of the map features compares with the
size of the geographic objects they represent. Depending on the map scale, a
feature such as a city can appear as a point or as a polygon. As well as
shapes, a symbol characterizes map features. (e.g., color, shade, thickness,
and marker)
# Attributes
The
information that GIS store about map features is referred to as attribute
information, or attributes. GIS formats attributes in rows and columns,
and stores them as tables. Each column stores a different attribute and
each row relates to a single feature.
The link between map features and their attributes is the basic
principle behind how GIS work, and is the source of its power. Once the map
features and attributes are linked, you can access the attributes for any map
features or locate any feature from its attributes in a table. It can also
display features based on any attributes in the table.
# Themes
Desktop
GIS links sets of features and their attributes and manages them together in
units called themes. (Themes are the ArcView specific term; they
are named differently in other GIS softwares; for example, Arc/Info uses the
term Coverages; Sometimes it is called Layer) A theme contains a
set of related features, such as roads, streams, parcels, or wildlife habitat
areas, along with the attributes for those features.
# GIS
database
All
the themes for a geographic area taken together make up a GIS database (often
called spatial database). You can use the themes in a GIS database to analyze
multiple situations and solve multiple problems.
R1. GIS Resources on the Web
R1.1 GIS faq
http://www.census.gov/geo/www/faq-index.html
R1.2 GIS Dictionary
http://www.geo.ed.ac.uk/agidict/welcome.html
http://www.esri.com/library/glossary/glossary.html
R1.3 Data Sources
http://www.geographynetwork.com/
http://geography.usgs.gov/products.html#digital_data
http://www.esri.com/data/download/census2000_tigerline/index.html
http://www.census.gov/main/www/cen2000.html
http://www.ngdc.noaa.gov/ngdc.html
R1.4 GIS Researches and Applications
R1.5 GIS Web Resources
http://www.gsd.harvard.edu/~pbcote/GIS/web_resources.html
http://www.geo.ed.ac.uk/home/giswww.html
http://sunsite.berkeley.edu/GIS/gisnet.html
http://www.partsgeek.com/parts/gis_resources.html
R1.6 ESRI Web Site
http://www.thesnugg.com/geography-resources-for-mapping.aspx