3. Thematic Mapping
3.1 Getting a Data into ArcView
3. Thematic Mapping
3.1 Getting
a Data into ArcView
# Shapefiles
Shapefiles
are ArcView’s own format for storing features and attributes. You create
shapefiles by converting other spatial data sources, by drawing shapes in
themes you create, or by using tabular data containing location information.
Shapefiles usually come with three files whose extensions are named .shp, .shx
and .dbf. Without any of these files, themes will not be displayed. Shapefile
file extensions and their functions are:
|
File extension |
Functions |
|
.shp |
the feature geometry |
|
.shx |
an index to the feature geometry |
|
.dbf |
the associated dBASE file of
attribute information |
# The Add Theme
dialog box
Click “Add
Theme” button ![]() . The Add Theme dialog box lets you add a theme from a
feature data source by default. Double-clicking on the name of the data source
adds it to the current view as a theme. By holding down Shift, you can select
and add more than one data source at once. In case the themes are too many, you
can stop listing all themes by entering ESC key.
. The Add Theme dialog box lets you add a theme from a
feature data source by default. Double-clicking on the name of the data source
adds it to the current view as a theme. By holding down Shift, you can select
and add more than one data source at once. In case the themes are too many, you
can stop listing all themes by entering ESC key.
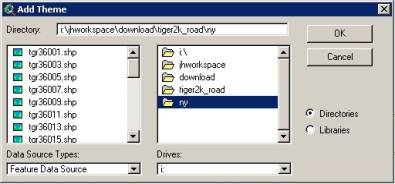
The following
figure shows the example of adding Arc/Info coverages. Since coverages
can contain multiple features in one coverage, feature types can be listed by
clicking the name of coverages. Shapefiles are shown with extension “.shp”
while coverages come with no extension. (Coverages may look like a folder if
you look at in the Windows Explorer; Coverages stores geometric information and
attributes separately in the different folders.)
You can also
add image themes by selecting Image Data Source in “Data Source Types:” dropdown
list in the lower left. Usshdrlf.tif is the image file while other files
without extensions are Arc/Info Grid.
You can edit shapefiles in features as well as in attributes. Data from other sources may be edited as well by converting them to shapefiles even though data itself is not editable.
Shapefiles are editable; From Theme menu, “Start Editing” is enabled.
Coverages are
not editable; From Theme menu, “Start Editing” is disabled.
# The Table of
Contents
Table
of Contents gives you the information of themes such as file names and feature
types. In shapefiles, each theme contains one feature type unlike Arc/Info
coverages. You can turn on or off themes by check or unchecking the check box
next to the theme’s name. The order in which themes are drawn on a view is
based on the order they appear in the Table of Contents. You can change the
order a theme is drawn in. For example, polygon may cover up line or point, so
you may need to put the polygon theme down to the bottom. Just drag the theme
up or down in the Table of Contents. You can remove themes. You can copy a
theme and paste into other view.
Suppose
you want to use “identify” tool to find out which attributes are associated
with a certain feature in the view. Before using this tool, you need to set the
active theme. The operations you can perform are required to know which theme
they work on. Making a theme active is just as
easy as clicking on the theme’s name in the Table of Contents. The active theme
will highlight. Now you can perform any operation such as select, identify,
find, and query builder over the active theme.
With GIS, you
can create maps based on the attributes of your interest. Good thematic maps
should meet intended purposes, as well as convey the message effectively. The ArcView Legend Editor lets you
choose thematic map types as well as map symbols.
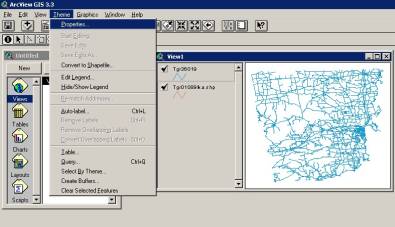
# Legend Types
To create a thematic map, you should
first select the active theme by clicking the theme name in the Table of
Contents. Legend editor is open either by double-clicking the active theme in
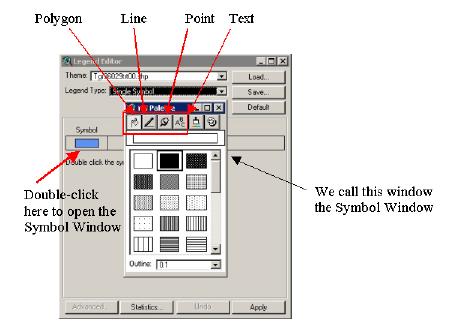
the Table of Contents or by clicking Legend Editor button ![]() . Now take a close look at the Legend Editor. Legend Editor
shows the active theme on the top. Legend type allows you to choose what
types of thematic maps you want to make. The list of available legend types is
different depending on feature types. For example, polygon feature type does
not support “Graduated Symbol”(feature size), but support Dot density map which
is not supported in line and point feature type. In the example below, the
feature type is polygon as shown in the shapes under the heading of Symbol.
. Now take a close look at the Legend Editor. Legend Editor
shows the active theme on the top. Legend type allows you to choose what
types of thematic maps you want to make. The list of available legend types is
different depending on feature types. For example, polygon feature type does
not support “Graduated Symbol”(feature size), but support Dot density map which
is not supported in line and point feature type. In the example below, the
feature type is polygon as shown in the shapes under the heading of Symbol.
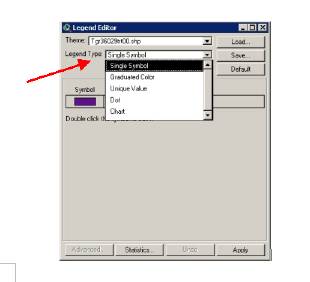
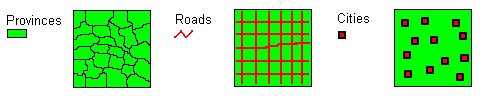
¨ Single Symbol
All the
features in the theme are displayed with the same colors and symbols. This is
useful when you only need to show where a theme’s features are located.
¨ Graduated Color
Features are
displayed with the same symbol type, but the shade (e.g., dark blue to light
blue) or similar color (e.g., warm tone, cold tone) represents the progression
of values for a data attribute you specify.
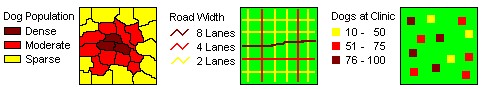
¨ Graduated Symbol
The features
are displayed with the same colors and symbols, representing a progression of
values. This is the best way to symbolize data that expresses size or
magnitude. Graduated symbol is only available for point and line data.
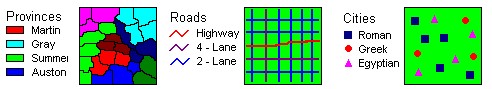
¨ Unique Value
Each unique
value in a theme is represented with a unique symbol. This is the most
effective method for displaying categorical data. Unique Value lets you create
qualitative thematic maps.
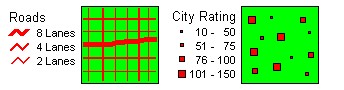
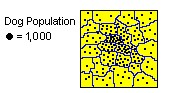
¨ Dot Density
The features
of a polygon theme are displayed with a number of dots corresponding to a
value. This method is good for showing how particular things are distributed
throughout an area. For instance, a dot map depicting population will most
likely have the strongest concentrations of dots along rivers and near
coastlines. Dot density is only available for polygon data.
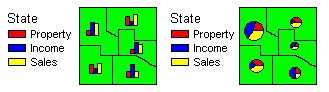
¨ Chart
The features
are displayed with a chart. The components of the chart correspond to data
attributes you specify, and the size of each part in a chart is determined by
the value of each data attribute. You can specify whether the charts are pie
charts or column charts. This is a good method for displaying the values of
many attributes.
# Choosing an
Appropriate Legend
ArcView's
Legend Editor helps you make a visually appealing map that communicates your
data to your target audience. You only need to know a little bit about the data
you wish to map.
¨ Is your data categorical, like names of places or types of
roads?
Use
the Unique Values Legend Editor.
¨ Is your data ranked, like best sales territory to worst
sales territory?
Use
either Graduated Symbols or Graduated Colors as these types of legends are best
suited to show a progression of data values. However, if your data is
qualitative, Unique Values may also be appropriate.
¨ Is your data raw count, like population or barrels of crude
oil?
For
polygon data, your first choice of legends should be Dot Density. If you have
point or line data, then use a Graduated Symbols legend. If you use a Graduated
Symbol or a Chart legend you may also want to consider normalizing your data’s
values to make your legend easier to read.
¨ Is your data normalized, like percentage data or population
per unit of area?
For polygon data, your first choice of legends should be Graduated Colors. If you have point or line data, then use a Graduated Symbol legend. If you need to show several normalized attributes, consider using the Chart legend.
When a map
type is chosen, ArcView automatically checks through fields of an active theme
whether they are categorical (field type is usually character indicating the
code) or numeric, and then filter the fields depending on the map type chosen.
(To find out, compare the fields available when a quantitative thematic map
(e.g., graduated color) is chosen, to those when a qualitative thematic map
(e.g., unique value) is chosen.) ArcView guides you to choose the right type of
field suited for map types. When creating quantitative thematic maps such as
graduated color, and graduated symbol, the data is classified into the
manageable number of groups using natural break. You can try other
classification methods (e.g., quantile, standard deviation), as well as change
the number of groups, and ranges for each group.
“Unique
Value” allows you to choose categorical attributes (e.g., Sumlevel) as well
while “Graduated Color” allows you to choose numeric attributes only.
Example
of Unique Value method (e.g., Road Type Map by management agency)
(Data source: New York State GIS Clearing house – CLASS for road, Aerial Photo for backdrop image)
Good for
displaying raw count data over polygon feature type
Population
normalized by area; different size of areal units (census tracts) gives a false
impression
Good for
displaying several related attributes
Good for
displaying quantity over point or line feature
To open the
Symbol Window, choose Show Symbol Window from the Window Menu. Or alternatively
when legend editor is already open, double-click the shapes under the heading
of Symbol in the Legend Editor. ArcView’s Symbol Window contains five palettes
(Fill, Pen, Marker, Font, and Color), and a Palette Manager for customizing
palettes. The first four palettes
(Fill, Pen, Marker, Font) are used to let you choose symbol suited to each
feature type (polygon, line, point, label respective). On the contrary, Color
Palette is used to assign color to any of those feature types.
# Fill, Pen,
Marker, and Font Palette
With Fill
Palette, you can choose how to fill the polygon (e.g., color-filled, empty,
pattern-filled). With Pen Palette, you can choose the pattern for the line
(e.g., solid, dashed, double). With Marker Palette, you can choose the marker
suitable for the point theme (e.g., basic shapes such as point, rectangle,
triangle, and conventional symbol such as school, church, hospital). Font
Palette lets you select a font to draw the label. If you scroll the list of font available, you can find there
is ESRI font. The font set allows you to create the marker so that you can work
on more marker. To load additional marker, just select ESRI font (e.g., ESRI
cartography) from the font list, and then click “Create Marker” button at the
bottom.
# Color Palette
Color
Palette lets you select color for polygon, line, point, and text. Color
dropdown list shows the foreground by default. Since point and line do not have
area (less than one dimension), changing color to point and line does not have
to specify Background and Outline. That is to say, Background and Outline only
applies to polygon features. Text only applies to labels. Sometimes you need to
display polygon features in transparency so that the feature may not block
other features. To display transparent polygon, set Background to nothing while
Foreground is set to pattern-filled.
Using Palette
Manage will also let you meet your customization needs such as loading existing
palette files (“.avp”), importing image files to markers, and saving current
palette as a new file.
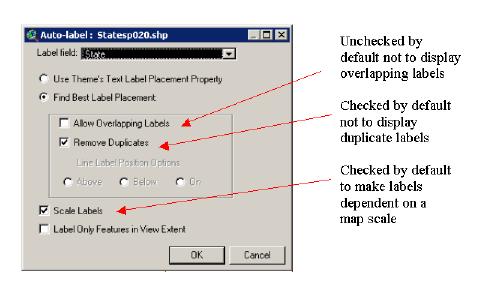
# Auto-Labeling
Themes
Labeling
themes makes users easier to identify features. To label, select Auto-Label
from the Theme menu after making a theme of your interest active. Then select
the field to be used for labeling. The default is that a text size is dependent
on map scales, and overlapping labels are automatically removed.
Auto-labeling
labels all features when no features are selected. When features are selected,
labels will be drawn only for the selected features. You can change font and
size of labels using Font Palette in the Symbol Windows.