7. Map Projections and Coordinate Systems
7.1 Map Projections
7.3 Setting Map Projections
in ArcView
Display countries in different projections
Display U.S. States in right projections
Display South Pole in right projections
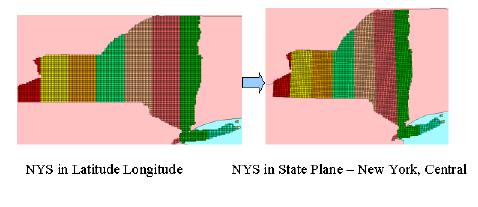
Display Western New York in right projections
7.4 Manipulating Map Scales
in ArcView
Control the display of a specific theme
7. Map
Projections and Coordinate Systems
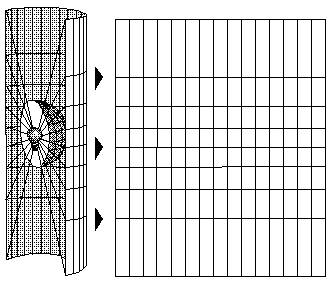
Maps are flat, but the surfaces they represent are curved. Transforming three-dimensional space onto a two-dimensional map is called ‘projection’. Projection formulas are mathematical expressions which convert data from a geographical location (latitude and longitude) on a sphere or spheroid to a representative location on a flat surface. This process inevitably (unavoidably) distorts at least one of these properties - shape, area, distance, direction - and often more. Because measurements of one or more of these (distorted) properties are often used to make decisions, anyone who uses maps as analytical tools should know which projections distort which properties, and to what extent. Briefly, conformal maps preserve local shape, equal-area or equivalent maps retain all areas at the same scale, equidistant maps maintain certain distances, and true-direction maps express certain accurate directions.
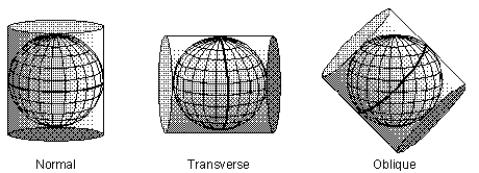
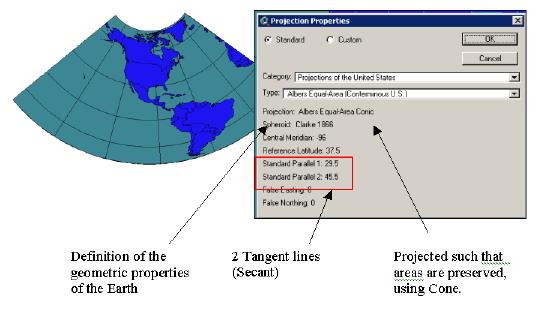
The first step in projecting from one surface to another is to create one or more points of contact. Each contact is called a point (or line) of tangency. A planar projection is tangential to the globe at one point only. Tangential cones and cylinders contact the globe along a line. If the projection surface intersects the globe instead of merely touching its surface, the resulting projection is called a secant rather than a tangent case.
Tangent Case Secant Case (Two standard Parallels)
Whether the contact is tangent or secant, the contact point or lines are significant because they define the point or lines of zero distortion. Lines of true scale are often referred to as standard lines. In general, projection distortion increases with distance from the point of contact.
Many common map projections are
classified according to the projection surface used: conic, cylindrical and
planar. Cylindrical projections result from projecting a spherical surface onto
a cylinder. Conic projections result from projecting a spherical surface onto a
cone. Azimuthal(or Planar)
projections result from projecting a spherical surface onto a plane.
Miscellaneous projections include unprojected ones such as rectangular latitude
and longitude grids and other examples of that do not fall into the
cylindrical, conic, or azimuthal categories.
■ Projection
of a Sphere onto Cylinder
Mercator Projection where the standard line is
the equator
UTM results from
projecting onto a 6 degree longitudinal strips instead of projecting onto a
whole sheet of flat surface.
■ Projection of
a Sphere onto Cone
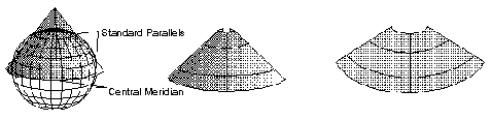
Good for
mid-latitude area such as U.S. because the standard line is at mid-latitude
area. For example, Lambert Conformal Conic projection has two standard
parallels at both 33 and 45 degree.
■ Projection of
a Sphere onto Plane
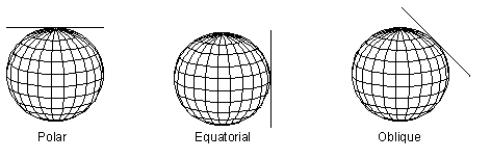
There are
many different coordinate systems, based on a variety of geodetic datums,
units, projections, and reference systems in use today. A datum is a set
of parameters defining a coordinate system, and a set of control points whose
geometric relationships are known, either through measurement or calculation
(Dewhurst 1990). A datum is defined by a spheroid (or ellipsoid), which
approximates the shape of the Earth, and the spheroid’s position relative to
the center of the Earth.
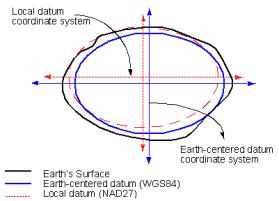
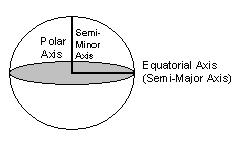
- Spheroidal Parameters Global vs Local Datum
Coordinate
systems can be seen broadly as two kinds: one is spherical (unprojected)
coordinate system (that is three dimensional) where latitude and longitude are used
to reference the location, and by definition this system is unprojected. The
other is planar (projected) coordinate system where 3 dimensional earth is
transformed into 2 dimensional flat surface through projection. Also it is
possible to divide coordinate systems into global versus local. Global
coordinate systems are used globally (so you can refer all regions in the world
using one system such as UTM). Local coordinate systems are designed to fit a
local region, so you can’t use them in other regions. (e.g., U.S. state plane,
U.K. national grid)
■ Global
Coordinate Systems
¨ Latitude
Longitude (a.k.a Geographic Coordinate System)
- Unprojected (Projection itself indicates the
transformation from 3 dimensions to 2 dimension); represents the location
in the three dimensional
surface by longitude and latitude.
- The Prime Meridian and the Equator are the reference
planes used to define latitude and longitude.
- The latitude of a point is the angle from the
equatorial plane to the vertical direction of a line normal to the
reference ellipsoid.
- The longitude of a point is the angle between a
reference plane and a plane passing through the point, both planes being
perpendicular to the equatorial plane.
¨ Universal Transverse Mercator (UTM)
- A kind of Transverse Cylindrical projection, but the
standard line varies with the regions in the world
- UTM zone numbers designate 6 degree longitudinal
strips extending from 80 degrees South latitude to 84 degrees North
latitude.
- UTM zone characters designate 8 degree zones extending
north and south from the equator.
■ Local
Coordinate Systems (United States)
¨ State Plane Coordinates
- divides all fifty of the United States, Puerto Rico
and the US Virgin Islands into over 120 numbered sections, referred to as
zones. Depending on its size, each state is represented by anywhere from
one to ten zones.
- Three projections are used: the Lambert Conformal
Conic for zones running east and west, the Transverse Mercator for zones
running north and south, and the Oblique Mercator for one zone only, the
panhandle of Alaska.
- developed in the 1930s and was based on the North
American Datum 1927 (NAD27). (NAD 27 coordinates are based on the foot.)
- The State Plane System 1983 is based on the North
American Datum 1983 (NAD83). (NAD 83 coordinates are based on the meter.)
7.3
Setting Map Projections in ArcView
We learned map projections have been developed to represent the curved earth in a flat surface, thus it is unavoidable to distort their geometric properties such as area, distance, shape, and direction through the projection process. Which projection to use is dependent on which geographic region you are interested in, as well as the purpose of using maps. It is obvious that we want to use map projections such that the extent of distortions can be minimized for the area of interest. That is why we have seen so many projections that fit into a certain geographic area as well as a specific purpose.
When publishing geographic data, they usually come with metadata where spatial reference information is defined to which you can refer. Metadata defines coordinate system, projection (e.g., unprojected, UTM), map units (e.g., decimal degree, meters), and geodetic model (e.g. datum, spheroid) in the Spatial_Reference_Information item.
Example of Geographic coordinate system: (TIGER 2000) http://www.census.gov/geo/www/tiger/rd_2ktiger/tlrdmeta.txt
Example of UTM: (NYRoute system from NYDOT)
http://www.nysgis.state.ny.us/gis3/data/dot.nyroute.html
Example of Lambert Azimuthal Equal Area: (USNationalAtlas)
http://nationalatlas.gov/shadedm.html
The most common form of
the spatial reference is the latitude and longitude. When you add themes that
are stored in geographic coordinate system, ArcView View shows the coordinates
of the point you are pointing at. Just look at cursor location while you are
moving around the cursor in the view area when a theme is added.
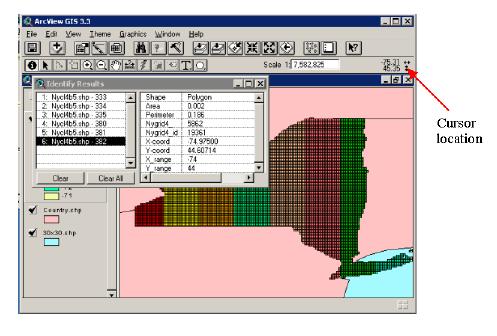
Decimal degree shown in the cursor location (i.e., degrees of longitude-latitude expressed as a decimal rather than in degrees, minutes and seconds) indicates the data is stored in the Latitude Longitude. Choose Properties from the View menu, the Projection should be set to None because it is the unprojected coordinate system. Map units should be decimal degree. Map units are the units of the view’s display surface. For example, the data stored in UTM, the map units should be in meters as defined in the coordinate system.
In ArcView. a view's map
projection can only be set if the map units of the spatial data it contains are
decimal degrees. In ArcView, you
can choose the appropriate projections and play with them as long as the data is
in decimal degree.
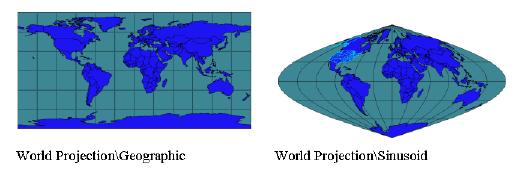
Display
countries in different projections
a. In a View, Add country and 30x30 from c:\GTKAV\DATA\CH07\ by
clicking ![]()
b. In case 30x30 covers country, hold down the 30x30 to the bottom in the Table of Contents
c. Choose Properties… from the View menu
d. Click Projection… button
e. Make sure Standard option box is checked on the top
f-1. Select “Projections of the World” for Category field, and select “Geographic” for Type field
f-2.
Select “Projections of the World” for Category field, and select “Geographic”
for Type field
Display U.S. in right projections
f-3. Select “Projections of the United
States” for Category field, and select “Albers Equal-Area (Conterminous U.S.)”
for Type field
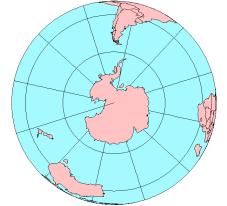
Display South Pole in right projections
f-4. Select “Projections of a
Hemisphere” for Category field, and select “Orthographic – South Pole” for Type
field
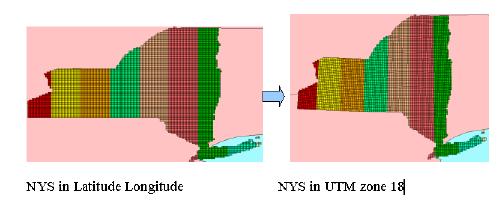
Display Western New York in right projections
f-5. Select “State Plane - 1983” for Category field, and select “New York, West” for Type field
f-6. Select “UTM - 1983” for Category
field, and select “Zone 17” for Type field
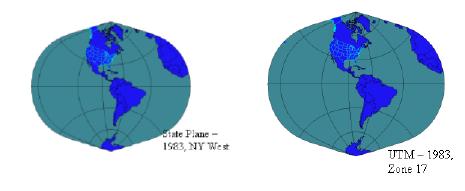
As you see from the map above, the local coordinate system is designed to minimize the distortion in the area of your interest. You should not use the local coordinated system for displaying larger area.
When your spatial data is not in decimal degrees, and you are using data from a variety of different data sources on the same view, you should make sure that all these data sources are currently stored in the same map projection. If you draw data sources that are currently stored in different map projections on the same view you may get errors and inaccurate results.
7.4
Manipulating Map Scales in ArcView
If you look at View
Properties menu, you will see Map units as
well as Distance units. Simply put, map units are the units which the spatial
data is stored in. If the view has not been projected, map units are the units
in which the coordinates of the spatial data are stored. If the view has been
projected, map units are the units into which this data is being projected in
the view. To find out in which map units the spatial data is stored, you need
to look up the data dictionary or metadata. All the ready-to-use data that
comes with ArcView is in decimal degrees, and the majority of spatial data
available for use in ArcView from commercial data vendors is provided in
decimal degrees. Local government GIS data in the USA is frequently stored in
feet using the State Plane coordinate system (NAD 27) instead of decimal
degrees.
ArcView uses the map
units setting to determine the correct scale of your view. With unknown map
units, a map scale will not be shown in the scale bar. To work with map scales,
you may need to set map units.
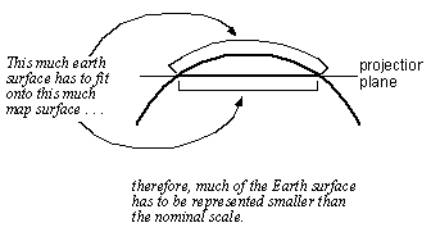
Map scale is the
relationship between the dimensions of a map and the dimensions of the Earth.
It is usually expressed as a ratio between a distance on the map and a distance
on the Earth, like 1:63,360. The scale ratio 1:63,360 means that one unit of
distance on the map represents 63,360 of the same units of distance on the
Earth. So on a 1:63,360 scale map, one inch on the map equals one mile on the
ground because one statute mile has 63,360 inches.
Distance units are the
units used by ArcView to display or indicate: The results of measurements you make on a view with the
Measure tool ![]() . The dimensions of shapes you draw on a
view with the Draw tool
. The dimensions of shapes you draw on a
view with the Draw tool ![]() . The dimensions of the selection box you
define when selecting features in a particular area on a view with the Select
Feature tool
. The dimensions of the selection box you
define when selecting features in a particular area on a view with the Select
Feature tool ![]() . The distance tolerance specified in the
Select By Theme dialog box for selecting one set of features from another. The
offset distance specified in the Geocode Addresses dialog box for placing the
location of an address event.
. The distance tolerance specified in the
Select By Theme dialog box for selecting one set of features from another. The
offset distance specified in the Geocode Addresses dialog box for placing the
location of an address event.
a. In order for
ArcView to display the scale of your view correctly, the Map Units of the
spatial data in your view must be specified correctly
b. Click inside
the scale field.
c. Type in your
desired scale ratio.
d. Press ENTER.
The view will redraw at the scale you specified, centered on the middle of the
view
¨To measure
distance
a. Set the
Distance Units in the View properties menu
b. Click the
Measure tool ![]()
c. Use the mouse
to draw a line representing the distance you wish to measure. The line can have
one or more line segments.
d. Double-click
to end the line.
The measurements are
displayed in the ArcView status bar, shown in the current distance units of the
view.
¨To measure
area
a. Set the
Distance Units in the View properties menu
b. Drag the
mouse on the Draw tool![]()
c. Choose Draw
Polygon tool ![]()
d. Use the mouse
to draw a polygon representing the area you wish to measure.
e. Double click
to end the polygon
The measurements are
displayed in the ArcView status bar, shown in the current distance units of the
view.
You can delete and move
the graphic using the Pointer tool ![]() . You can
also set symbols for graphics from Graphic Properties menu.
. You can
also set symbols for graphics from Graphic Properties menu.

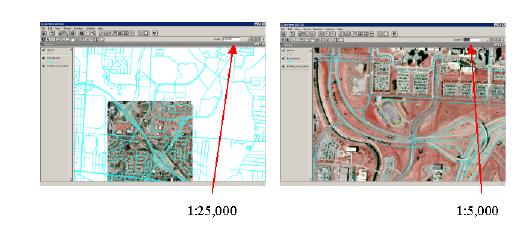
Control
the display of a specific theme
- by scale
- by attributes
From the Theme
Properties menu
Choose Display: Set
maximum scale to display it only in the large scale (e.g., local street); Set
minimum scale to display it only in the small scale (e.g., highway).
Choose Definition: Build
query such that it can represent the features that wish to be displayed (e.g.
only want to show the road whose category is county road)