GEO381/550 Lecture Notes of September 2, 2004
The map
defined
Map
= graphic representation of the milieu
Map is a model
of reality
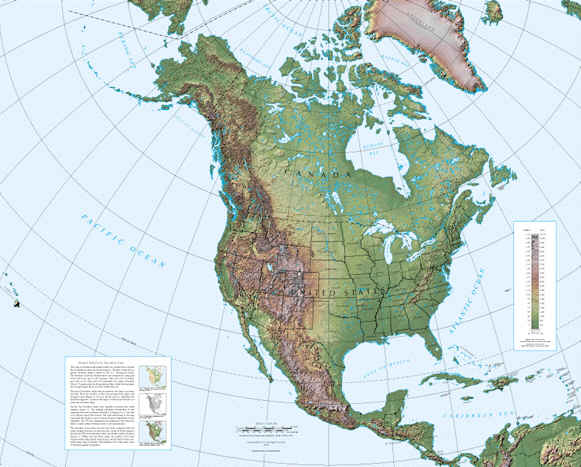
Source:
USGS National Atlas Shaded Relief Map
- Reduce
areas on the earth fitted to small sheet of map à map
scale
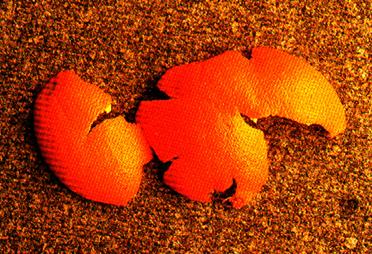
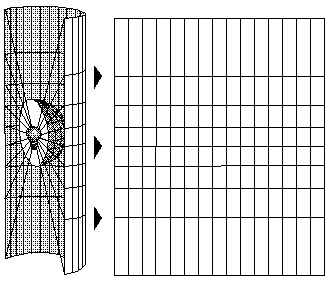
- Flatten
curved earth to the flat map à map projections
- Abstract
geographical reality through selection, and symbolization à map
symbols (cartographic abstraction and generalization)
- select
relevant features: does not show everything only shows relevant features
a. generalize
features: simplify unnecessary details
b. emphasize/eliminate
a specific feature depending on map purpose
c. symbolize
features (e.g. markers used for indicating school or church)
Three
elements of maps: (1) scale (2) map projections (3) map symbolization
They
are interdependent: e.g. scale determines the degree of generalization,
scale is decided upon map projections.
*Requirements
of good map
- choose scale
such that general trends/pattern can be pronounced while relevant
specifics are not masked, not to mention it has to show the complete (geographic)
area of interest
- choose map
projections such that the distortion can be minimized and serves the
purpose of map (e.g. navigation, thematic mapping)
- Choose
map symbols such that the gap is reduced between what map authors are
intending to convey and what map viewers can interpret by associating
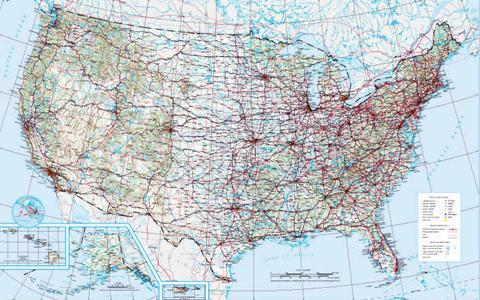
meanings with the symbol. Often the association relies on (1) convention
(e.g. interstate shield; look the map below) (2) intuition (e.g. dark
shade linked to high magnitude of value) or (3) legends

Source: USGS National Atlas
Power of map
Maps are worth
a thousand words
Unlike
other modes of communication (e.g. word, number), maps are visual. It is an
“effective” way of conveying message – fast, and retentive
Census
2000 Gateway: http://www.census.gov/main/www/cen2000.html
e.g. compare the table showing median age by state to choropleth map
When to use
maps versus when not to use maps?
- want to
know “overall” spatial distribution of variables of interest à go to
map
- want to
know exact value of each enumeration unit à refer to
the list of values
For example, classification of value
masks details
You may need to provide the relevant numeric
values if necessary along with map.
Kinds of map (D1:6-10)
Compare
Figure 1.4 to Figure 1.5
1. Reference map (general-purpose map):
show location of multiple features
2. Thematic map (single-purpose map): show
topical subject
a. qualitative:
nominal data (e.g. administrative boundary, agricultural region) Fig 1.6
b. quantitative:
numerical data (e.g. population density, income) Fig 1.7
The
boundary between reference map and thematic map is not necessarily crisp. Often
the division relies on convention.
Classification
of kinds of maps (Figure 1.3)
Quiz:
what is reference map, and what is not reference map? If it is thematic map, is
it qualitative or quantitative?
Distribution
of urban and rural population
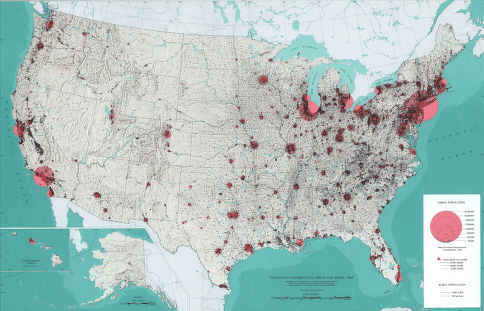
Source:
USGS National Atlas
Topographic
map
Source:
USGS National Atlas
Distribution
of Indian tribes & language
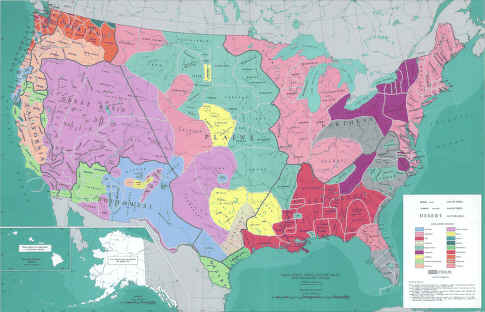
Source:
USGS National Atlas
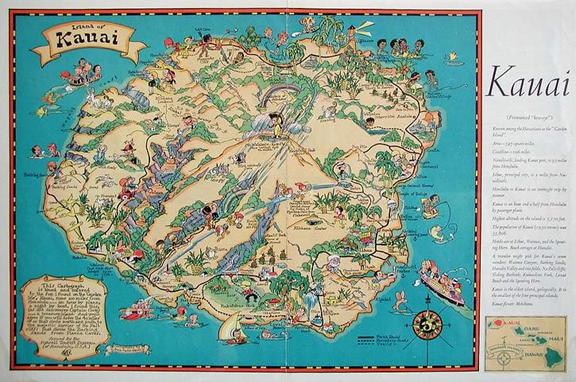
Source:
Old map gallery
Scanned
Image of 24K topographic map (a.k.a USGS DRGs (Digital Raster Graphics))

Source:
USGS
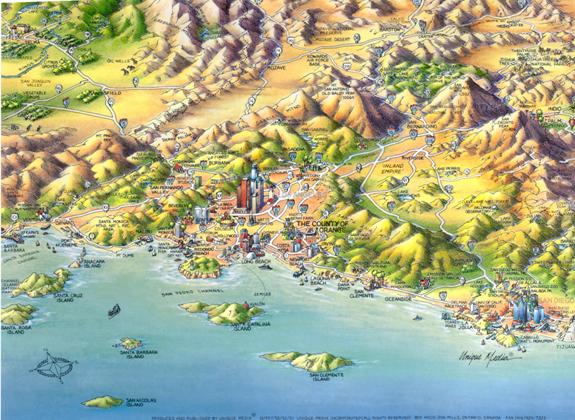
Source:
Unique Media Inc.
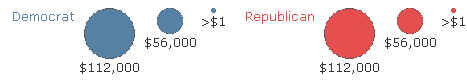
Source:
Fund Race 2004
URL
Odden’s Bookmarks: http://oddens.geog.uu.nl/index.php
Old
Map Gallery: http://www.oldmapgallery.com/catalog/
USGS
DLG http://topomaps.usgs.gov/drg/
Fund
Race 2004: http://www.fundrace.org/citymap.php
Does
it portray a consistent topic?, does it show spatial distribution
of a particular phenomenon or just show the location of multiple features?, the
amount of qualitative information presented
Component of
thematic map (D1:10-11)
Figure
1.10
(1) base map: can
be extracted from reference map
(2) thematic
overlay: can be collected from survey, existing database, and so on
Relevant
base map should be chosen.
Map scale (D1:11-12, D2:36-37, M2:5-8)
0.
how to read scale ratio?
See
Plate 14 – look at scale ratio
Where
left-hand side represents dimension on the map and right-hand side represents
dimension on the earth; both are in the same unit
(d)
1:1,000,000 means 1 dimension on the map represents a 1,000,000 dimension on
the mapped earth; 1-inch line on the map represents 1,000,000-inch (equivalent
to 15.78 miles) stretch on the earth
Do
the same for (c)
1.
what is scale?
=
map distance / earth distance
Tells
us how much is reduced when transforming the earth area into the map plane
2.
three customary ways of expressing scale on a map
(1)
representative fraction (RF) 1:25,000
(2)
graphic bar scale ![]()
(3)
verbal scale “one
centimeter represents 10 kilometers”
Q.
which methods do you think will be robust particularly
when you have image files that will be zoomed in and out?
3.
convert RF to verbal scale, and vice versa
Eg1)
1:250,000
Plate
14 (c)
1
centimeter on the map represents ? kilometers
on the earth
1
inch on the map represents ? miles
on the earth
Where
1 mile equals 63360 inches
Eg2)
1 inch to 4 miles (where 1 mile equals 63,360 inches)
4
miles = ? inches
Therefore,
scale ratio will become 1:253,440
Eg3)
4 inches to the mile
4:
63,360 = 1: x
x
= 15,840
Therefore,
scale ratio will become 1:15,840
Eg4)
The distance between two known points on a map is 5 miles. What is the scale of
a map on which the points are 3.168 inches apart? (text
p.37)
3.168
inches to 5 miles
5
miles equals 316,800 (=5*63,360)
3.168:316,800
= 1:x
x
= 100,000
Therefore,
scale ratio will become 1:100,000
Eg5) Look at Plate 14 (b). You know the
scale is 1:100,000 from the bottom. Somebody asks you “what will be the real
distance (in miles) between city hall and ③ when you drive along Main
St?” Answer him or her.
4.
Small scale map versus large scale map
USGS
DLG Product information: http://edc.usgs.gov/products/map/dlg.html#description
Small-scale
map: < 1:30,000,000 show large earth area
Large-scale
map: > 1:24,000 show small earth area in detail
Intermediate-scale
map: in-between
But
no rigorous numerical boundaries; rather they are relative
Confusing?
But remember 1/30,000,000 < 1/24,000
Loot
at Plate 14: which is mapped in a smallest scale? (a)
or (d)?
Map
scale and its effect on mapped earth area, map information, and symbolization (Figure
1.11)
Map
scales in paper map versus GIS: zoom in & zoom out
Scale
is fixed in paper map, but scale varies in GIS as you zoom in/out
Note
the spatial data itself are derived from paper map or other sources
In
the metadata, read data preprocessing part (mostly in identification part).
Example
of spatial data derived from small-scale map (e.g. National hydrological unit):
http://nationalatlas.gov/hucsm.html#1
Example
of spatial data derived from large-scale map (e.g. school district):
http://www.nysgis.state.ny.us/gis3/data/orps.schooldist00.html#Identification_Information
Map
projections
Peel
and flatten the earth like orange peel
Visualize
projecting a light through the Earth onto a surface (called the projection
surface)
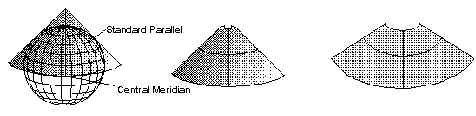
1.
Can be classified by
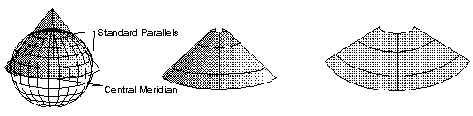
(1)
Which shape of the projection surface is used: cone, cylinder, plane
Conic projection
Cylindrical projection
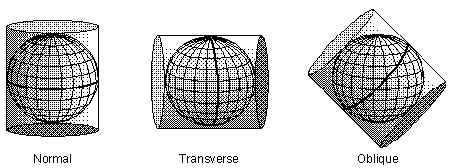
Planar
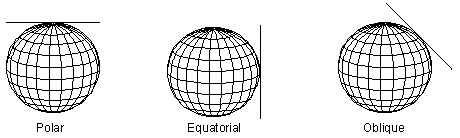
(2)
Where to contact: point of contact (tangent), line of contact (secant)
Tangent
Secant
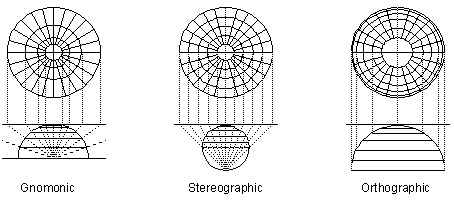
(3)
From where the light source is emanating: center, surface, infinite point (only
applied to planar projections)
2.
Projection methods determine the geometric properties of resulting maps
(1)
conformal
(2)
equal-area
(3)
equidistance
(4)
true direction
3.
Map projections will be chosen depending on
(1)
map purpose: thematic mapping, navigational maps, and
so on
(2)
the extent of the area to be mapped: world,
hemisphere, continent or small-region
(3)
location of the earth to be mapped: polar,
mid-latitude, or equatorial region
4.
Coordinate system
Defined
by datum, map projection, and so on
Can
be divided into (1) universal CS (e.g. UTM) (2) local CS (e.g. SPC)
You
can define your own coordinate system too.
Real-world
problem, suppose you are working as a GIS analyst, and you obtain the data set.
How do you know in which coordinate system the data is stored?
Check
metadata – spatial_reference_information.
http://www.nysgis.state.ny.us/gis3/data/orps.schooldist00.html#Spatial_Reference_Information
What
about working on dataset from different coordinate systems?
e.g. school district boundary in UTM and state boundary in
geographic coordinate system.
Cartographic
abstraction and generalization (D1:15-17)
How
you make the balance between specifics and general; suppress unimportant
information and make important information pronounced; choose a symbolic code
based on an understanding of graphic logic and the limitations of visual
perception
Consists
of the following four parts
- Selection
Choose where to map, how much to be
reduced (scale), map projections, data variables, and so on
- Classification
Reduces the complexity of the map image,
thus enhances communication
a. Qualitative (e.g.
agricultural region)
b. Quantitative
(e.g. housing price)
- Simplification
(Figure 1.14)
Compare
large-scale cartographic boundary file to small-scale cartographic boundary
file
- Symbolization
Since it is not possible to create a
reduced image of the real world, cartographers devise a set of marks (symbol)
that stand for real-world things.
- Replicative: looks
like real-world features (e.g. lake, road)
- Abstract:
does not look like real-world features (e.g. circles, triangles)
Good match between data (e.g. point,
line, area) and symbol
Good match between measurement (e.g.
quantitative, qualitative) and symbol
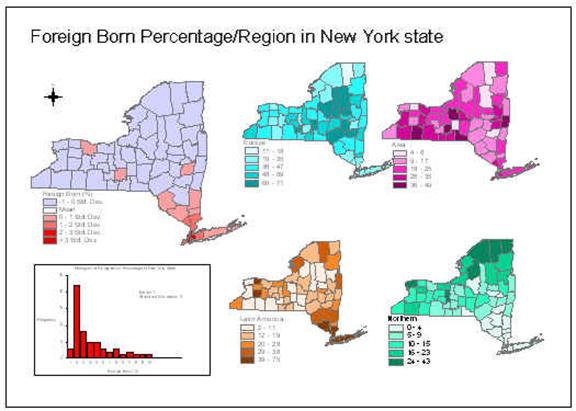
The role of
map (D1:12-15)
1.
Help map readers identify unknown pattern (e.g. correlation between racial
diversity and housing price: good research tool); let map readers gain a new
spatial knowledge; high degree of human-map interaction; cognitive interaction;
more leeway for map readers
2.
Convey message; present knowns; low degree of
human-map interaction
Illustration
for 1
Correlation
between racial diversity and housing price?
Illustration
for 2
M7:95 Figure.7.6
A
model of map visualization and communication (figure 1.12)
- Map
visualization: private realm, visual thinking, unstructured symbol, map
users
- Map
communication: public realm, visual communication, structured symbol, map
authors
Where
should a map design be situated?
What is map
design? (D1:17-18)
A
model of map communication (figure 1.13)
Should
be aimed at reducing the discrepancy between what map authors intend to convey
and what map readers interpret
Should
be able to take into account what users want, and what users already have known
- involves
specification of the selection of scale, map projections, symbols, and so
on
- is intellectual
and visual
- intellectual
in that it relies on the foundations of sciences (communication,
geography, psychology)
- visual
in that it communicates through a visual medium
Aim
is to achieve the efficient and accurate transfer of knowledge between map
author and map user