Lab3 of Geo520, Spring 2005
TA : Julie Hwang
Lab 3. File Formats across GIS
Working with Selection and Charts
Objectives
The objectives of this lab are to understand the file formats across GIS, to work with the Selection, and to create Charts.
File Formats across GIS
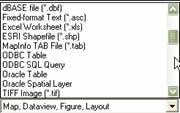
______ Scroll down from the Files of type drop-down list in the File Open window to browse through other file formats readable in TransCAD. TransCAD can read some external files directly, and also allows you to import/export them. In this lab, we’re working on external file formats (eg. Shapefiles, ODBC Table).
Using
Other Geographic File Formats
TransCAD can import geographic data from many other file formats, including Arc/Info export (e00) files, AutoCAD DXF files, ESRI Shapefiles, Mapinfo Interchange Format (MIF) files, Spatial Data Transfer Standard (SDTS) FILES, Digital Elevation Model (DEM) files, and so on.
Among them, ESRI shapefiles and Map/Info TAB file can be read directly in TransCAD, thus they can be added as a layer similar to TransCAD geographic files.
TransCAD assumes other geographic file formats are stored in geographic coordinate system (eg. longitude and latitude). So if you work on the data from different coordinate system, you may have to set the coordinate system before importing the file.
Using Other Attribute File Formats
TransCAD can read many formats of tabular files. For example, it can read .dbf file, text files, ODBC Table, and so on. If attribute files contain longitude and latitude information in it, TransCAD will prompt you whether to create a layer from them.
Practice #1: Create maps using the Map Librarian
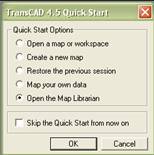
______ Check the
Open the Map Librarian radio box when Quick Start dialog box pops up. Click OK.
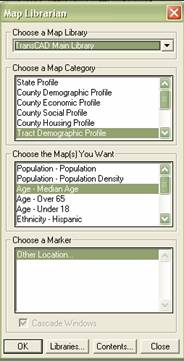
Map Librarian can also be accessed by choosing Map-Librarian….
______ When the Map Librarian dialog box pops up, choose the Tract Demographic Profile from the Choose a Map Category list, and Age-Median Age from the Choose the Map You Want list, and then click OK.
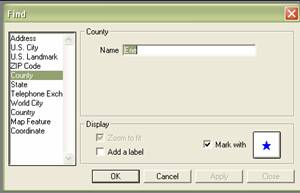
______ In the Find dialog box, choose County in the
left hand side, and type in
______ Create more maps in the same area, say
Commute by Transit or Commute by Walk, using Map Librarians
______ Create more maps in other areas, say your
hometown.
Practice #2: Select features by condition
______ Make Census Tract an active layer. Then look
at its dataview. It seems that they have all census
tract records in the
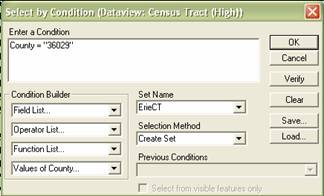
______ You can select records by the condition.
Choose Selection-Select by Condition…. When the Select by Condition
dialog box pops up, type in the appropriate condition in the text box using
field, operator and function drop-down list. Type in County = “36029”. The value
is the FIPS code equivalent to
______ How many census tracts are in
Parctice #3: Export selected features
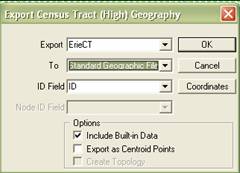
______ Choose Tools-Export… making sure the
Census Tract is an active layer in Maps. Choose ErieCT
from the Export drop-down list, and choose Standard Geographic File from the To
drop-down list. Name the file in the Save As window. Keep this file in your
home directory because you will need this file for the assignment.
______ Open the geographic file you just exported as
a new map.
Practice #4: Create a chart
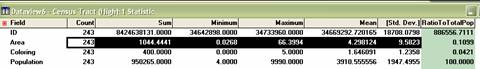
______ Compute statistics of Erie County census
tracts.
______ Write down the total population of
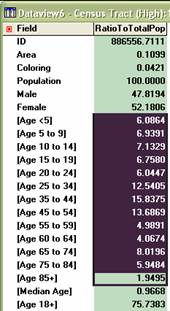
______ Create a new field and fill the value in the
new field named RatioToTotalPop by dividing SUM by the value of
total population you just wrote down. For instance, what is the percentage of male
in
______ Hide fields you don’t want to look at.
Highlight any row from the field Count to the field Std. Dev, and then click ![]() (Hide Columns) or choose Hide in the right mouse click.
(Hide Columns) or choose Hide in the right mouse click.
______ Highlight the cell as shown below. (You may
have to drag the mouse from [Age 85+] to [Age < 5] because the order to drag
matters in graphics that will be shown later.)
______ Click ![]() (New Chart) next to the Open Dataview toolbar.
(New Chart) next to the Open Dataview toolbar.
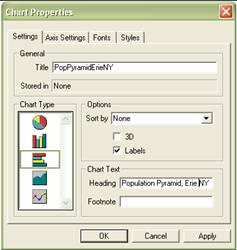
______ In the Chart Data dialog box, click OK.
______ In the Chart Properties dialog box, choose
the chart type: horizontal bar graph, and edit the chart text: Population
Pyramid,
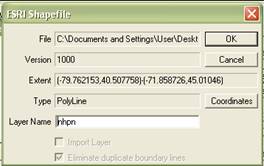
Practice #5. Add ESRI Shapefiles as a layer
______ Click ![]() (Map Layers) in the
(Map Layers) in the
Data source: http://websas.bts.gov/website/ntad03/statedownloadform.html
______ Click OK in the ESRI Shapefile
window.
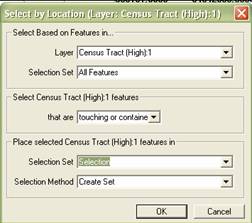
Practice #6. Select features by location
______ Make nhpn an active
layer. Choose Selection-Select by Location…
______ Select features of NHPN that are touching
Erie Census Tract.
______ Export the selected features of NHPN into
standard geographic files. Then add the file as a new layer after you close nhpn layer in shapefiles.
Practice #7. Create a Map Layer from ODBC table
TransCAD allows you to work with ODBC table. For
example, if you have already worked with mdb file
(MS-Access), you can directly access the content through TransCAD
user interface. Mdb file provided in this practice
contains NY State hospital attribute table, and a query that selects
______ Click ![]() (Map Layers), then click Add Layer button.
Choose ODBC Table from the Files of Type drop-down list in the File Open dialog box..
(Map Layers), then click Add Layer button.
Choose ODBC Table from the Files of Type drop-down list in the File Open dialog box..
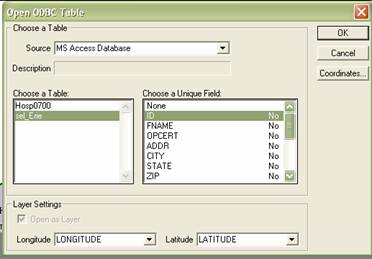
______ In the Open ODBC Table dialog box, choose MS
Access Database from the Source drop-down list.
______ Locate the nyhosp.mdb located in H:\GEO520\Lab3\ODBC when the
Select Database dialog box pops up.
______ Choose sel_Erie
from the Choose a Table list, and ID from the Choose a Unique Field list. Note TransCAD automatically geocodes attribute
table if the table lon/lat information in it.
Assignments (due at the beginning of next lab):
This
time, suppose you are asked to make a presentation concerning how the
relationship between poverty level and public transportation varies by localities.
Pick two study areas –
|
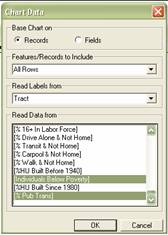
*To create the scatter plot of the whole study
area, without highlighting cells, choose All Rows from
the Features/Records to includes drop-down list, and choose two fields from Read
Data from drop-down list in the Chart Data dialog box (look at the figure at
the right). You also need to choose scatter for the Chart Type list in the
Chart Properties dialog box. |
|