Lab4 of Geo520, Spring 2005
TA : Julie Hwang
Lab 4. Working with Matrices
Objectives
The objectives of this lab is to work with Matrices. For
the assignment, you will be working on journey-to-work data from CTPP (Census
Transportation Planning Package).
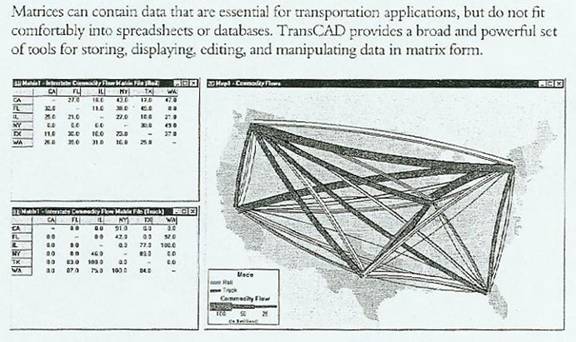
Matrices
Matrices are commonly used in storing information about flow data: traffic among zones, distance among geographical locations, and so on.
Practice #1: Create matrices from a map layer
______ Open the map FLINTBRY.MAP in the Tutorial
folder (use the shortcut at C:\temp\ in case you don’t remember the path to the
folder).
______ Choose File-New… or click
![]() .
Choose Matrix file in the New File dialog box to display the
Create Matrix File dialog box.
.
Choose Matrix file in the New File dialog box to display the
Create Matrix File dialog box.
______ Type “Flintbury Zones”
as the name of the matrix file, and choose ZONE from the IDs are in drop-down
list. Rename matrix1 to mymatrix by typing in the
textbox at the bottom. Click OK.
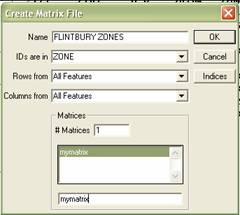
______ Type “myzones” as
the file name and click Save.
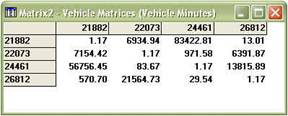
Practice #2: Display matrix row and column marginals
______ Open the matrix file OD.MTX in the Tutorial
folder. (You need to choose Matrix from the Files of type drop-down
list.)
______ Check how many matrices are open from the
drop-down list on the toolbar. It should be three – vehicles, travel minutes,
and vehicle minutes. Keep the matrix Vehicles active.
TransCAD stores
matrices in a Matrix file. A matrix file contains one or more matrices,
each of which contains the same set of rows and columns. You can add or delete
matrices by choosing Matrix-Contents….
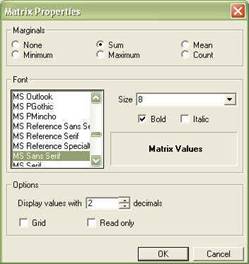
______ Choose File-Properties… or click ![]() on the toolbar.
on the toolbar.
______ Choose the Sum radio button in the
Matrix Properties dialog box. Click OK.
______ Choose File-Properties… or click ![]() on the toolbar.
on the toolbar.
______ Choose the Mean radio button in the Matrix
Properties dialog box.
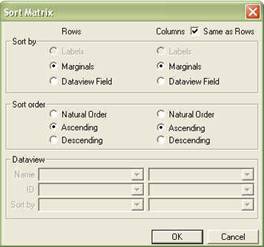
______ Sort values in matrices by choosing Matrix-Sort….
Practice #3: Edit matrices
______ Highlight several cells in the matrix and
choose Fill… in the right
mouse button (or choose Matrix-Fill… or click ![]() on the toolbar) to display the Fill Matrix dialog box.
on the toolbar) to display the Fill Matrix dialog box.
______ Click Add Value to Cells and type 10
in the Value box. It will add 10 to existing values, say 100 becomes
110.
______ Choose Vehicle Minutes from the
drop-down list on the toolbar and choose Matrix-Fill… or click ![]() on the toolbar.
on the toolbar.
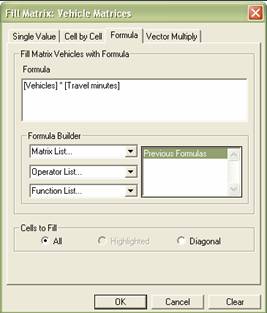
______ Click the Formula tab.
______ In the Formula Builder, choose [Vehicles]
from the Matrix List drop-down list, then choose * from the Operator List
drop-down list, and [Travel minutes] from the Matrix List drop-down list. Click
All to fill all cells in the matrix, then click OK.
______ Choose Matrix-Fill… or click ![]() again.
again.
______ Click Clear Cells, and Click OK. TransCAD will displays a confirm dialog box. Click Yes.
Practice #4 Update matrices
You can update all cells or the highlighted cells in
the current matrix with values from other matrices in other matrix files as long as two matrices have the same dimension
with equivalent id fields.
______ Open the matrix file UPDATE.mtx
in H:\GEO520\Lab4.
______ Choose Window – Matrix? – Vehicle Matrices
to make the matrix the active window.
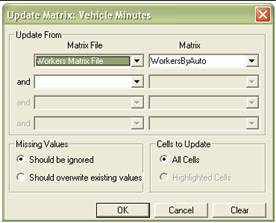
______ Choose Vehicle Minutes from the
drop-down list on the toolbar and choose Matrix-Update… or click ![]() on the toolbar.
on the toolbar.
______ Choose Workers Matrix file from the Matrix
File drop-down list and choose WorkersByAuto from
Matrix drop-down list.
Practice #5: Display a portion of matrix
______ Go back to FLINBRY.MAP. You may notice there in a selection as
highlighted. If you open its dataviews, you can also
see the selection named Downtown Zones. Now suppose you want to see only this
portion in the matrix. To look at a portion
of a matrix file, you must create a matrix
index.
______ Choose Window – Matrix? – Vehicle Matrices
to make the matrix the active window.
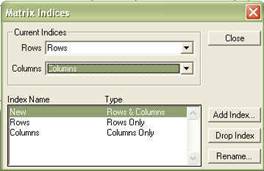
______ Choose Matrix-Indices… or click ![]() on the toolbar to display the Matrix Indices
dialog box.
on the toolbar to display the Matrix Indices
dialog box.
______ Click Add Index button to display the
Add Index dialog box.
______ Choose ZONE from both of the Field
drop-down lists. Choose Downtown Zones from the Selection drop-down list.
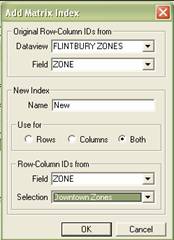
______ Choose New from the Rows and Columns drop-down list as shown
below.
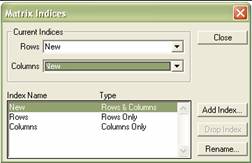
______ Click Close. TransCAD displays the indexed columns and rows in the
matrix view.
______ To go back to the old index, click ![]() , and choose Rows/Columns from the Rows/Columns drop-down
list.
, and choose Rows/Columns from the Rows/Columns drop-down
list.
______ Choose File-Close All.
Practice #6: Create desire lines
Desire lines are used to illustrate on a map the
flows of people or goods from point to point based on the values from a matrix.
See
the first page for an example.
______ Choose File-Open Workspace… and open Desire.wrk in the Tutorial folder.
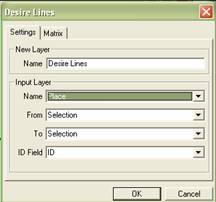
______ Choose Tools-Geographic
Analysis-Desire Lines… to display the Desire Lines dialog box.
______ Type “Desire Lines” in the New Layer Name
edit box. Choose Place from the Input Layer Name drop-down list.
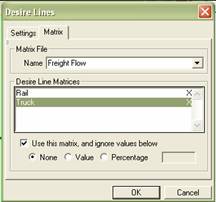
______ Click the Matrix tab to display the Matrix
page.
______ Choose Rail from the Desire Line
Matrices scroll list, check the Use This Matrix box, and choose the None radio button.
______ Choose Truck from the Desire Line
Matrices scroll list, check the Use This Matrix box, and choose the None radio button.
______ Click OK. Type “Mydesire” as the file name and click Save
when the Save Layer As dialog box.
______ Choose File-Close All.
Practice #7: Convert dBase file to matrices, and vice versa
______ Click ![]() ,
then open the dBase file DISTANCE.DBF in the Tutorial folder. Take a look at
how the OD data is stored in dbf file.
,
then open the dBase file DISTANCE.DBF in the Tutorial folder. Take a look at
how the OD data is stored in dbf file.
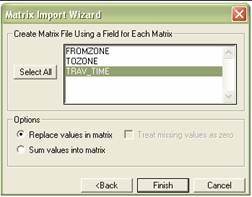
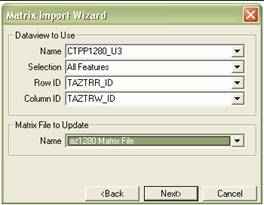
______ Choose Matrix-Import… to
display the Import Matrix Wizard.
______ Click Next.
______ Choose FROMZONE from the Row IDs drop-down
list, TOZONE from the Column IDs drop-down list, and click Next.

______ Choose TRAV_TIME from the scroll list and
click Finish to display the Save As dialog box.
______ Type “myimport” as the
file name and click Save. TransCAD imports the dataview into a matrix file and displays it in a matrix
view.
______ You should know how
to read both matrix and dbase file. Rows in the matrix become the origin (fromzone), and columns become the destination (tozone). For example, find the value from the row 1
and column 3, and verify the value in the dbase file.
______ To export the matrix
file to dbf file, choose Matrix-Export… when the matrix is open. Choose
matrices to include, and give a name.
Assignments (due at the beginning of next lab):
In
this assignment, you will be creating the matrix file and desire lines from the
dBase file that contains journey-to-work flow between traffic analysis zones in
Buffalo-Niagara Falls Region. Follow the steps below.
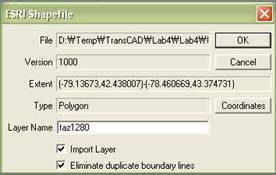
Step1.
Open the Shapefiles named taz1280 in
H:\GEO520\Lab4\UrbanGeographic (Make sure you checked Import Layer radio box at the bottom
of the ESRI Shapefile dialog box, which will
import the file rather than just read it temporarily).
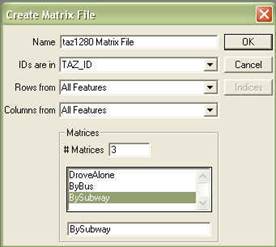
Step2.
Create a matrix file based on features of a map layer taz1280. In the Create
Matrix File dialog box, choose TAZ_ID from the IDs drop-down list, and make
three matrices (each can be named DroveAlone, byBus, and bySubway) compose the
new matrix file.
Step3.
Open the dBase file named CTPP1280_U3 in H:\GEO520\Lab4\Journey-to-Work.
The definition of fields in the table is described below:
|
SYS_FIELD_NAME |
FIELD_DESC |
|
TAZTRR_ID |
Traffic Analysis Zone ID of Residence area |
|
TAZTRW_ID |
Traffic Analysis Zone ID of Work area |
|
U301_0202 |
Workers leaving home during peak period who drove alone |
|
U301_0210 |
Workers leaving home during peak period traveling by Bus or trolley
bus |
|
U301_0212 |
Workers leaving home during peak period traveling by Subway, or
elevated |
Step4.
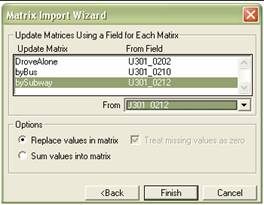
Convert the dBase file CTPP1280_U3 to matrices. This time you’re updating matrices (you write the
value of dbase file to an existing matrix file you created from TAZ1280 in the step1).
![]()
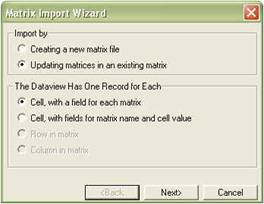
TAZTRR_ID
refers to origin (Row ID in TransCAD), and TAZTRW_ID
refers to destination. Journey-to-work is from home to work. Also make sure
you choose the right fields for the update matrix from the From
drop-down list – Choose Drove Alone in the Update Matrix, and then choose
U301_0202 from the From drop-down list, and so on.
Some
cell contains null value (I mean no commuting). Make sure you understand how
the value is stored in matrices. For example, how many workers commute from zone
8 to zone 1 by driving alone? What about commuters by bus or subway?
Step5.
Do the followings from the matrices you just created.
(1)
Answer the following three questions.
a.
What is the total number of workers who commute by
driving alone during the peak period in this study area? What about those by
bus? What about those by subway? (Total number of workers by transportation
mode)
b.
Which zone received the most workers who commute by
driving alone? What about those by bus? What about those by subway? (Top
destination by transportation mode)
c.
Which zone sent the most workers who commute by
driving alone? What about those by bus? What about those by subway? (Top origin
by transportation mode)
Write down zone IDs in the table below for answers,
and submit the table.
|
|
Auto |
Bus |
Subway |
|
Total Number of Workers |
|
|
|
|
Top Destination Zone |
|
|
|
|
Top Origin Zone |
|
|
|
Number of zones that meet the condition above should be five (one zone satisfies two condition at the same time). Let’s say those zone id is labeled a, b, c, d, and e.
(2) Create desire lines for top destination/origin zones, which is marked as the shaded cells in the table above (Create selection by condition, say TAZ_ID = {a, b, c, d, e}, and then make desire lines from the selection: make sure to include three modes in desire lines). Also display the matrix showing only the zones {a, b, c, d, e. Submit the layout that includes desire lines and the matrix.
**CTPP data used for this assignment are
readily downloadable from the BTS website (click Data, and type in CTPP in the
Search input box). Alternatively you can also order them in CD-ROM free of
charge (click Product and type in CTPP in the Search input box). Data is based on 1990 census.