Lab8 of Geo520, Spring 2005
TA : Julie Hwang
Lab 8. Route System
Objectives
The objectives of this lab are to introduce route system, and to work with route systems in TransCAD.
Route Systems
A route is
a series of line segments that has at least one common attribute, such as a
route number, a service frequency, and so on (eg.
designated highway route, truck route between delivery points, bus route, and
subway route).
Selected
features from a regular line layer (highway, streets, railroads)
are used to define a route. When defining a route system, each line feature
that is part of a route is referred to as a segment. Every route is made
up of a series of segments.
Practice #1: Create a route system
To create a route system, you must open a line layer, on which the routes are
based, and create a network based on
the line layer.
______ Copy the directory H:\GEO520Lab\Lab8\Practice
to your own space, and open geographic file ubroads
in your space.
______ Create a Network
based on ubroads (use Network/paths-Create), name it ubnet and save it in your own space.
_____ Make sure Road Features is active and the
current network is ubnet
______ Choose File-New or click ![]() on the toolbar to display the New File dialog
box.
on the toolbar to display the New File dialog
box.
______
______
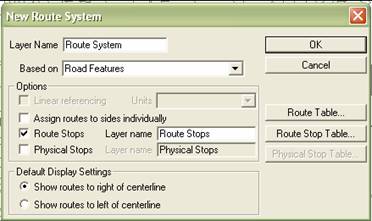
_____ Click Route Table… to create an attribute table for links of
route system.
_____ When New Table
windows pops up, add a field and name it as Passenger (# of passengers).
_____ Ok; (this will bring you back to the
previous window)
_____ Ok
_____ Save the route
system file to your own space, say myroute
Now the route system should be the working
layer (visible in the layer drop-down list). However, for the time being, it is
still an empty layer. (Look into the dataview of the
layer Route System to see if it’s the
case). You can also see the Route Stops layer in the layer drop-down list since
you choose to create the stop.
____ Choose Procedures-Route systems to activate the Route
Systems menu if it is not the choice of the menu.
____
____ Click ![]() , then
click on the intersection between Niagara Falls Boulevard/I-290 and
double-click on the intersection between I-290/Main St. TransCAD
displays the New Route Name dialog box.
, then
click on the intersection between Niagara Falls Boulevard/I-290 and
double-click on the intersection between I-290/Main St. TransCAD
displays the New Route Name dialog box.
Sheridan/I-290 Millersport/I-290 Millersport/Sheridan Millersport/Maple UB South UB North Main/I-290 Niag/I-290
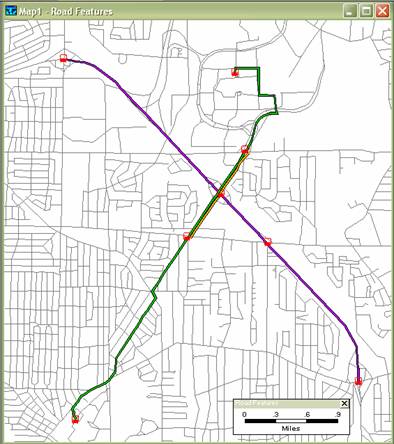
______ Type “1” in the text box and click OK. TransCAD shows the shortest path between the two points you
clicked.
______ When the route is created, click ![]() (green light) on the
route systems toolbox to save it. To cancel the changes, click
(green light) on the
route systems toolbox to save it. To cancel the changes, click ![]() (red
light) and then all the changes you make after the last time you
saved the changes will be removed from the route.
(red
light) and then all the changes you make after the last time you
saved the changes will be removed from the route.
______ TransCAD add this
route to the layer Route System, and names it “1”. Look into the dataview of the layer Route System.
______ Add another route named “2” from south campus
to north campus through Millersport. Make sure you save the changes by clicking
green light.
Practice #2 Add stops to the route
______ Choose ![]() in the Route System toolbox, and click on the route“1” to which
you want to add the stops.
in the Route System toolbox, and click on the route“1” to which
you want to add the stops.
______ Click ![]() to add stops to the four intersections in
the route: the starting point, I-290/263(Millersport), I-290/Sheridan, and the
ending point.
to add stops to the four intersections in
the route: the starting point, I-290/263(Millersport), I-290/Sheridan, and the
ending point.
______ Add stops to the four intersections in the
route“2”: the
starting point, Sheridan, Maple and the ending point.
______ Save the edit using the green light button.
______ Look into the dataview
of the layer Route Stops.
Practice #3 Get driving directions and milepost information
______ Choose the route system layer from the
drop-down list on the toolbar.
______ Choose Route Systems-Route Query Toolbox.
______ Choose a route from the drop-down list. TransCAD highlights that route on the map.
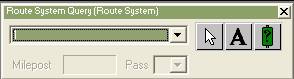
______ To get driving directions for the highlighted
route, click ![]() .
.
______ Click ![]() , then
click on the bus stops from the starting point to the ending point. The toolbox
will report the milepost (how far from the starting point).
, then
click on the bus stops from the starting point to the ending point. The toolbox
will report the milepost (how far from the starting point).
______ Get driving direction for the route 2, and
find out the milepost of stops along the route. (you
can also select the route by clicking ![]() , then
choose the layer in a map).
, then
choose the layer in a map).
Practice #4 Find routes based on start and end of service
Route Service Toolbox can answer questions such as:
Which bus routes go from the shopping mall to the heart of downtown? Which
airline flights provide service between
______ Choose Route Systems-Route Service Toolbox.
______ Click ![]() to draw the start of service location - draw a
shape around UB south campus by clicking at points to define the shape and
double-clicking to close the shape.
to draw the start of service location - draw a
shape around UB south campus by clicking at points to define the shape and
double-clicking to close the shape.
______ Click ![]() to draw the end of service location – drawn a
shape around UB north campus.
to draw the end of service location – drawn a
shape around UB north campus.
______ Click ![]() to evaluate the routes serving.
to evaluate the routes serving.
______ Clear routes serving by clicking
![]() .
.
______ Clear start and end by clicking ![]()
Practice #5 Set route system styles
______ Open the dataview
of Route System.
______ Fill in the value for the field “Passenger” –
respectively 353 for route 1 and 134 for route 2.
______ Create a scaled-symbol map of the layer Route
System such that the number of passengers will be displayed (Map-Scaled-symbol
map)
______ Remove a scale-symbol map (Click remove
button in the Scaled-Symbol Dialog box)
______ Add another route from the intersection
Millersport/Sheridan to the intersection Millersport/Maple. Make sure the
changes have been saved by clicking the green light.
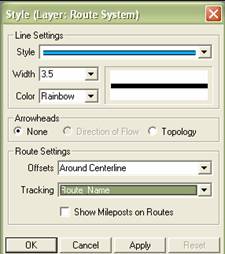
______ Click ![]() when the layer Route System is active.
when the layer Route System is active.
______ Choose 3.5 from the Width drop-down
list. Choose Around Centerline from the Offsets drop-down list. Click
OK.
______ Play with other options such as On
Centerline or Right/Left of Centerline to see how they are
different.
Practice #6 Create bands (buffering)
______ Make the Route System an active layer.
______ Select route 1 either by ![]() on the toolbar or by
on the toolbar or by ![]() on the toolbox.
on the toolbox.
______ Choose Tools-Geographic Analysis-Bands
or click ![]() on the toolbar to display the Bands dialog
box.
on the toolbar to display the Bands dialog
box.
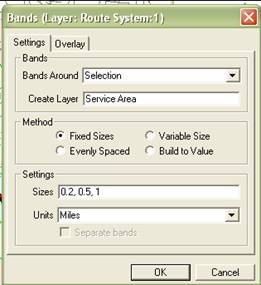
______ Make sure the Selection is on the Bands
Around drop-down list. (If you don’t make any selection, it will create the
band around entire features of the active layer). Type
“Service Area” in the Create Layer text box. Type
“0.2, 0.5, 1” in the Sizes text box.
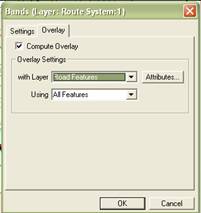
______ Click Overlay tab – check the checkbox
“Compute Overlay”, and choose “Road Features” from the With Layers drop-down
list under Overlay Settings. Give any name when the Save as dialog box pops up.
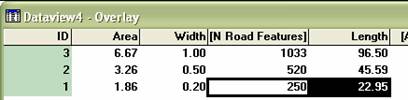
______ Interpret overlay results. The route 1 covers
250 road features with 22.95 road miles within 0.2 mile radius. Similarly, it
covers 96.50 road miles in total within 1 mile radius.
Assignments (due at the beginning of next lab - March
25):
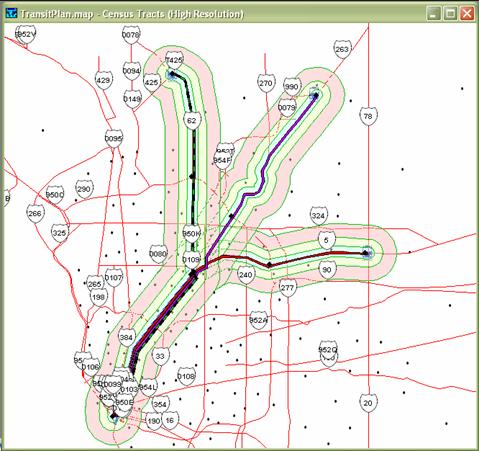
Copy
the directory H:\GEO520Lab\Lab8\Assignment to your own space, and open the
map TransitPlan.map in your space. There are several
layers such as the centroid of Census Tract, major
roads, transit (Buffalo Light Rail), and last stop. Census Tract layer will be
used to summarize the characteristics of population living within certain miles
bands around routes.
Your
assignment is to find out characteristics of potential passengers when the
transit in


In
this assignment, you will be creating routes, and 0.2, 0.5, 1 mile bands around
the routes. Finally you should report the number of potential passengers, and the number of families below poverty levels
of three different routes by three different bands. Use [population]/[area] for the first, and [Below pov
level: Families]/[area] for the second where [area] means the area of bands.
|
Potential passengers per unit area |
|
||
|
|
Within 0.2 mile |
Within 0.5 mile |
Within 1 mile |
|
Route1 |
|
|
|
|
Route2 |
|
|
|
|
Route3 |
|
|
|
|
|
|
|
|
|
Families below poverty level per unit area |
|
||
|
|
Within 0.2 mile |
Within 0.5 mile |
Within 1 mile |
|
Route1 |
|
|
|
|
Route2 |
|
|
|
|
Route3 |
|
|
|
The
followings are possible steps you should follow through in case you don’t know
what to do.
(1)
Create three routes from the downtown
(2)
When you create a new route system, add to the route
table six fields named POP_0.2, POP_0.5, POP_1, POV_0.2, POV_0.5, and POV_1
where you will fill in appropriate values. POP_x
indicates population per unit area within x miles radius from the route, and POV_x indicates families below poverty level per unit area
within x miles.
(3)
Create three bands (0.2, 0.5, 1 miles)
for each route such that the bands are overlayed with
the layer Census Tract.
(4)
Fill in the six fields described in (2) using the
result of step (3).
Submit
two tables above with the appropriate values filled. Submit two sets of maps.
The first set of maps should show the potential passengers per unit area in
three different bands. The second set of maps should show families below
poverty level per unit area in three different bands. (Make sure you use
scaled-symbol maps and display three routes around centerline).