Lab9 of Geo520, Spring 2005
TA : Julie Hwang
Lab 9. Linear Referencing Systems
Objectives
The objectives of this lab are to introduce linear referencing systems, and to work with linear referencing systems in TransCAD.
Linear Referencing Systems
 Data on networks often store location information using a route
identifier and a distance from a fixed point on the route. The distance
from the fixed point is known as the milepost (or measures in some
literatures).
Data on networks often store location information using a route
identifier and a distance from a fixed point on the route. The distance
from the fixed point is known as the milepost (or measures in some
literatures).

Practice #1: Work with mileposts
______ Copy the directory H:\GEO520Lab\Lab9\Practice
to your own space, and open the map SR5.map in your space.
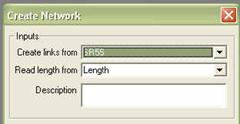
______ Create a Network based on the selection set
named SR5S. (use Network/paths-Create).
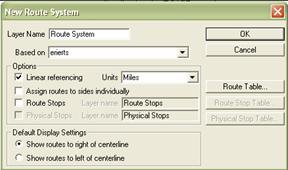
______ Create a Route System from the network you just
created. Make sure you check Linear referencing under Options in the New Route System dialog
box.
_____ Add a new route to Route System from the southernmost
node to the northernmost node in the selection set named SR5S. (Use Route Systems – Editing Toolbox). Give
the name “5” to a new route.
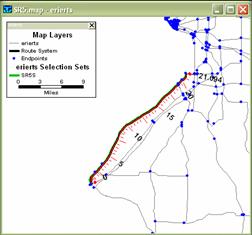
_____ Choose Route Systems – Route Query Toolbox when Route System is set to an
active layer. This time you will see more buttons because you chose Linear
referencing option which allows you to edit milepost values along the route.
Check the milepost value using ![]() .
.
_____ Make Endpoints layer shown and move down
the layer so that it can be shown over the route in a map (use ![]() ). You may
want to change the style of the layer to make it pronounced.
). You may
want to change the style of the layer to make it pronounced.
_____ Click ![]() when the active layer is the Route System.
Check the radiobox Show Mileposts on
Routes under Route Settings.
when the active layer is the Route System.
Check the radiobox Show Mileposts on
Routes under Route Settings.
Milepost values are not necessarily based on
the actual elapsed distance along the route. This can happen when the route
passes through multiple jurisdictions. You will be editing milepost values in
reference to the table provided for you.
_____ Open RTRAT.dbf in the directory you copied.
This table contains the information on new milepost values along the route you
just added. Look into two fields named BEGMPT and ENDMPT. The location of each
segment is stored using these two fields. For example, the first segment starts
from 0.155 and ends at 2.217. Note the starting milepost value is not 0.
_____ Click ![]() in the Route System Query Toolbox when the
Route System is an active layer and route 5 is chosen in the drop-down list.
in the Route System Query Toolbox when the
Route System is an active layer and route 5 is chosen in the drop-down list.
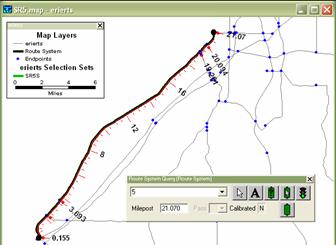
_____ Click on the starting node and then type
in 0.155 (this is the BEGMPT of the first record in the RTRAT.dbf) in the
Milepost inputbox. Do the same for the location of the next nodes. The ending
nodes should have the value of ENDMPT of the last records. Whenever you edit
the milepost values, make sure you commit the milepost values using the green
light button.
_____ Choose Window-Refresh. This will display
the new milepost values in the map as shown below.
_____ Keep these working files to save time for
the assignment.
Practice #2 Create milepost layers
We have learned
how to geocode data stored in street address or geographic coordinates. In this
practice, you will be geocoding data based on a linear referencing system. Two
kinds of milepost layers will be created with this; Point layer (e.g. accident)
requires “a milepoint in which route?”. Line layer (e.g. traffic volume)
requires “the start AND end milepoints in which route?”.
______ Open fars01_5.dbf and hpms01_5.dbf. The first table contains the point location of fatal traffic crashes in milepost values. The second table contains the line location of different segments in milepost values.
______ Take a moment how different the way the location information is stored. Scroll all the way to the right in fars01_5.dbf, and find the field MILEPOINT and Route_ID. It says each accident occurs in the milepoint value in the route. In hpms01_5.dbf, find the fields BEGIN_LRS, END_LRS, and Route_ID. It says each segment is located from BEGIN_LRS to END_LRS along the route.
______ Make the Route System an active layer. Choose
Route Systems – Linear Referencing – Attach….
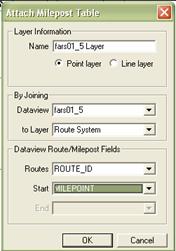
______ Choose fars01_5 from the Dataview drop-down
list, which will automatically give fars01_5 Layer as a name, and check the
optionbox Point layer. You are attaching a milepost table (fars01_5.dbf) to Route
System through Route Identifier (ROUTE_ID) and milepost values (MILEPOINT).
______ Make the fars01_5 layer active, and change the
style such that the layer can look pronounced. This is how you geocode the
point event data stored in mileposts along the route.
______ Make the Route System an active layer. Choose
Route Systems – Linear Referencing – Attach….
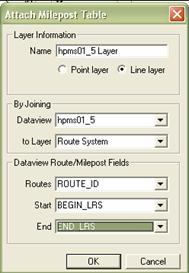
______ Choose hpms01_5 from the Dataview drop-down
list, which will automatically give hpms01_5 Layer as a name, and check the
optionbox Line layer. You are attaching a milepost table (hpms01_5.dbf) to
Route System through Route Identifier (ROUTE_ID) and milepost values (BEGIN_LRS
to END_LRS).
______ Make a scaled-symbol map of hpms01_5 Layer
using the attribute AADT (Average Annual Daily Traffic).
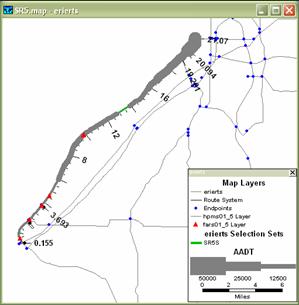
______ See if there is any correlation between
traffic crashes and traffic volume.
Practice #3 Create strip charts
Strip charts are a set of graphs that show the
characteristics of a route and how they vary along the length of the route.
______ Make the Route System active, then choose Route
Systems – Linear Referencing – Strip Chart….
______ Choose 5 from the Route drop-down list, and
choose attributes [hpms01_5 Layer].AADT, [hpms01_5 Layer].THROUGH_LA, and
[fars01_5 Layer].MILEPOINT (use ctrl key). Click OK.
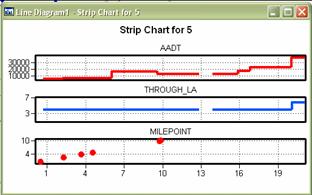
It seems that accidents are concentrated in the
segments between 1 and 10 miles from the reference points along the routes.
Practice #4 Convert a milepost layer to a geographic file
______ Choose Tools-Export while you choose
the milepost layer you want to convert in the layer drop-down list.
______ Choose the features to export, a file format,
and data field to convert the milepost layer into a geographic file.
Practice #5 Create intersection diagrams
______ Choose the layer erierts from the layer
drop-down list.
______ Choose ![]() (intersection diagram) in the toolbox.
(intersection diagram) in the toolbox.
______ Click on any intersection (eg.
______ In the Intersection Diagram dialog box,
choose LANES for the Forward Flow drop-down list, and LANES for the Reverse
Flow drop-down list.
Intersection
diagram will be displayed by taking into account the directionality of road
segments and their attributes you set in the flow drop-down list. If you have
the information of traffic flow that varies by the direction of the road
segment, you can specify them as well
Practice #6 Create prism maps
______ Open BOS_HWY.map in the Tutorial folder.
______ Make County an active layer.
______ Choose Maps-Prism Maps.
______ Choose [Sales Per Client] for the Field
drop-down list under Data when the Prism Map Properties dialog box pops up.
Click OK.
______ Play with prism map using 3D control toolbox
such as Rotate, Zoom, and Pan.
Practice #7 Create charts from tabulations
______ Open fars9601.dbf from the practice folder.
The file contains the fatal crashes in
______ Choose Statistics from the Procedures menu if
Statistics menu is not shown.
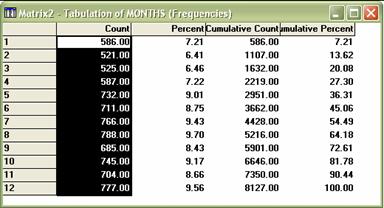
______ Choose Statistics-Tabulations. Choose
Months for Field1 drop-down list, List of Values for Method drop-down list, 13
for the # Classes drop-down list. This will create the tabulations of accident
frequencies by month.
______ Give any name when the Save As dialog box
pops up.
______ Look into the matrix. Which month shows the
highest rate of fatal traffic crashes? Choose all cells under the Count column.
______ Choose ![]() , then
choose Chart in the New File dialog box.
, then
choose Chart in the New File dialog box.
______ Make sure Selected Cells is checked in the
Matrix C hart data dialog box.
______ Choose vertical bar for the chart type, and
check the 3D and Labels under the Options.
______ In the resulting chart, double-click on the x
axis. In the Chart Properties dialog box, choose Axis Settings tab, and type in
400 for the From input box. Click OK.
______ Do the same for the field YEARS. Create the
bar chart showing how accident frequency varies by year.
Assignments (due at the beginning of next lab):
In this assignment, you will be doing the same thing
as you do in the practices. Use the data set provided in H:\GEO520Lab\Lab9\Assignment.
fars00_5.dbf is the linearly referenced fatal traffic crashes in year 2000 at
the Route 5 (you created in the practice #1). hpms00_5.dbf contains the
characteristics of the Route 5 by segments in year 2000.
1.
Create two milepost layers: (1) Point layer:
accident layer from fars00_5.dbf (2) Line layer: highway segment layer from
hpms00_5
2.
Create the chart showing how hazmat accident
frequency varies by month using hmirs02.dbf
Submit a map showing two milepost layers where
accident location and AADT for each road segment are displayed (practice #2).
Submit a strip chart that shows AADT, Lane, and accident location (practice
#3). Submit the chart of hazmat accident frequency by month (practice #7).
The data provided in this lab can be downloaded in BTS website,
particularly in the subject under Highway. Use the following link for download
and further information: http://www.transtats.bts.gov/Databases.asp?Mode_ID=3&Mode_Desc=Highway&Subject_ID2=0