Lab1 of Geo520, Spring 2005
TA : Julie Hwang
Lab 1. Introduction to TransCAD
Creating a Thematic Map
Objectives
This lab introduces you to TransCAD. After this lab, you
should get familiar with the general design of TransCAD GUI (graphic user
interface), and be able to create a variety of maps.
TransCAD
TransCAD
is a special GIS which is designed to facilitate modeling and analyses of transportation data.
TransCAD is a GIS: TransCAD provides all the tools
available in GIS such as creating maps, editing geographic data, and performing
spatial analyses.
** We will work on this on
the first three labs. Remainders deal with its functionalities specific to
transportation applications.
TransCAD is a special GIS for
transportation applications:
[1]
Extended data model
TransCAD
provides some special data models required to represent the static/dynamic
phenomenon specific to transportation applications such as matrices
(Origin-Destination data), route system (eg. bus route), linear referencing
system (eg. location of accident along highway), special topological network
(eg. one-way street system, overpass/underpass), turning restriction (eg.
necessary for finding the best route), and so on.
[2]
Special operations for transportation applications
With
TransCAD, you can input (eg. reading GPS data, address matching), process (eg.
editing network topology), manipulate (eg. conflation), and analyze
transportation data, Besides, TransCAD provides a complete application suite
for transportation planning, vehicle routing, and distribution logistics
(available in Standard Version only).
User interface of TransCAD
Open TransCAD (click Cancel button in Quick Start
window), and browse for its interfaces – Menu, Toolbar, and Toolbox. Toolbox
will not be shown. Toolbox pops up depending on what types of windows (eg.
Maps, Layouts) are open.
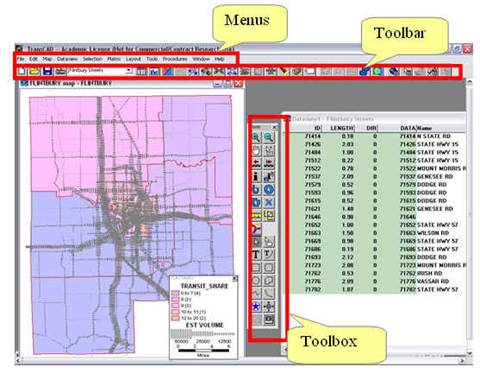
Maps, Dataviews, and Layouts
TransCAD
displays information on your computer screen in different types of windows: maps, dataviews, and layouts.
Each one is displayed in a separate window on your screen, and each one can be
saved for future use in files stored on your computer’s hard disk.
Maps show geographic features and their characteristics in an electric
version of a paper map. (similar to views
in ArcView)
Dataviews display information from geographic
files, databases, or spreadsheets in tabular format. (similar to tables in ArcView)
Layouts bring together any number of maps,
dataviews, and charts in a single presentation. (similar to layout in ArcView)
Workspace, Layers, and Geographic
files
All your open windows (Maps, Dataviews, and Layouts)
can be saved into a single file using a workspace. Workspaces are
similar to projects in ArcView
Maps are composed of many different layers of
information. For example, the sample road map for the
Geographic
files are own geographic file formats of TransCAD like Shapefiles in ArcView. Geographic files are displayed as layers in
a map.
Practice #1: Create a
thematic map
TransCAD
provides utilities for five types of thematic mapping. The five types of
thematic maps are choropleth map, pattern map, dot-density map, chart map, and
scaled-symbol map. You can access these utilities from the corresponding menu
items under “Map” menu.
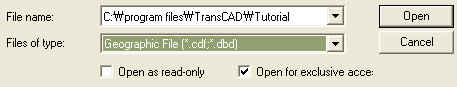
______![]() Open FL_ZONE.CDF,
a Geographic File from
the Tutorial directory (C:\program files\TransCAD\Tutorial).
Open FL_ZONE.CDF,
a Geographic File from
the Tutorial directory (C:\program files\TransCAD\Tutorial). ![]()
![]()
![]() You should choose Geographic File from the Files of type
drop-down list.
You should choose Geographic File from the Files of type
drop-down list.![]()
______Map-Layers…
(a small window should pop up) on the small window
______Click on Add Layer button. You
can add any number of layers to a map. You can also label the layer by clicking
Label button.
______
Select FL_ST.CDF from
the tutorial directory.
______
Save your work in your
home directory. File-Save
______
Display the data associated
with the layers by clicking on the “New Dataview” button ![]()
______
You can switch between
layers or different types of windows through the Layer drop-down List
(located next to New Dataview
button). The layer whose name appears in the drop-down list window is
the current working layer. Make sure that the Flintbury Zones is current in the layer drop-down list.![]()
______
Map-Color Theme… (to
create a choropleth thematic map) Another window should pop up. In the new
small window:
______
Choose TRANSIT_SHARE from Field drop-down list.
______
Set the number of classes.
______
Click on the Styles Tab, another window will come out.
______
Select appropriate styles.
______
Click Ok until only the main window is left open.
______
You can print the map by choosing File-Print…
(you will get an error
message if you click OK, ignore it; instead you can use Layout in Practice #2)
A. Choropleth mapping for area data
(Map-Color Theme… or Map-Pattern Theme…)
____
Open an area geographical file from the tutorial DIR. (FL_ZONE)
____
Have a look at the attribute table.
____
Make a meaningful thematic map (e.g. average income). A choropleth map is a
good way to represent standardized attributes such as percentage of age group
under 12, or population density. Pay attention to the various options available
for manipulating maps: legend, scale, colors…)
B. Dot density mapping (Map-Dot-density
Theme…)
____
Open an area geographical file from the tutorial DIR (FL_ZONE)
____ Take
a look at the attribute table
____
Create a dot density map based on an attribute of your choice. Dot density map
is good to represent raw numeric data such as population.
C. Symbol mapping (Map-Scaled-symbol
Theme…)
____
Open the FL_ZONE and add FL_ST to the view.
____
Create a symbol map based on a field of FL_ST (eg. length, etc.)
____
Create another symbol map based on a field of FL_ZONE. (# of HHs in the lower
income category). Scaled-symbol map is used to represent numeric attributes.
Practice #2
Using Layout
You can
put different types of documents such as maps, dataviews, and chart (we will
get into this in the future lab) in one presentation-friendly format, which is
called Layout in TransCAD.
______ Choose File-New… (or ![]() ). Then
choose Layout in the New File window. When the blank sheet is shown, choose
). Then
choose Layout in the New File window. When the blank sheet is shown, choose ![]() in the toolbox. Drag a mouse in the location
you want to locate the document you have worked on in the layout. You can add
as many documents (maps, dataviews, and charts) as much as you want.
in the toolbox. Drag a mouse in the location
you want to locate the document you have worked on in the layout. You can add
as many documents (maps, dataviews, and charts) as much as you want.
______
Use pointer tool ![]() to move, resize, and delete the graphic
elements. You can add text using Text tool
to move, resize, and delete the graphic
elements. You can add text using Text tool ![]() , add image
file using
, add image
file using ![]() , and so
on. You can change the orientation of layout by choosing File-Properties….
, and so
on. You can change the orientation of layout by choosing File-Properties….
______
You can print the map by choosing File-Print…
To set up (or change) a
printer, choose File-Properties…
Assignments (due at the beginning of next lab):
Use RI_CNTY.CDF, RI_HWY.CDF, RI_PLC.CDF from the tutorial directory. Make two thematic maps – One has to show the population of county, and the other has to show the followings together (i.e. three layers in one map): (a) per capita income of each county, (b) lane of each highway, and (c) population of each place. Hand in hardcopies of maps.