Geog 258: Maps and GIS
February 10, 2006 (Fri)
Qualitative thematic maps
Useful keywords for classifying maps
What purpose does the map
serve?
The function of maps: reference vs. thematic map
e.g. atlas vs. precipitation map
In which scale the theme is
measured?
The level of measurement: qualitative vs. quantitative thematic map
e.g. world organization map vs. world population density
map
In which manner is the theme
distributed in a geographic space?
Nature of phenomenon: discrete vs. continuous
e.g. road map vs. temperature map
In which geometric dimension
is the geographic feature portrayed?
Appearance
(dimensionality) of geographic features:
zero, one, and two-dimensional
e.g. tourist site map, road map, population density map
Quite different phenomena are
mapped in similar appearance (color-coded in area)
Q. Compare two maps by four
keywords given above
Indian
tribe in the conterminous
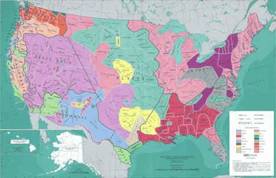
Indian
tribe in the conterminous

Reference map vs. Thematic
map
Reference map (aka multi-purpose map) shows the location of many
geographic features (e.g. topographic map, atlas)
Thematic map (aka single purpose map) shows geographic distribution of a
particular theme (e.g. world climate region map, precipitation map, population
density map, landcover map)
Qualitative thematic map vs. Quantitative thematic map
If a theme is measured in the
nominal scale, it is a qualitative thematic map
If a theme is measured in any
of the ordinal, interval, and ratio scale, it is a quantitative thematic map
Nominal level of information
tells you simply which category (class) a feature belongs to
Map symbolization for qualitative thematic map
Does map symbol type (graphic
element in the text) have a connotation of distinction
in kinds or types? {Shape, orientation, color hue}
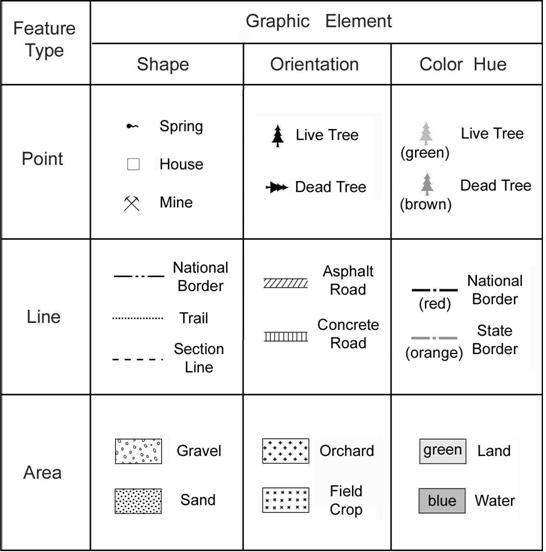
These symbols can be combined
as well; dead tree is represented with shape and orientation.
Two kinds of shape symbols
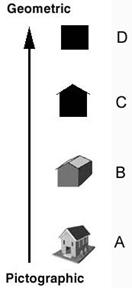
Pictrographic: intended to be intuitive by creating natural
correspondence between geographic features and its interpretation, should be
big enough to be read correctly (take much space in the map)
e.g. Hawaiian leisure map
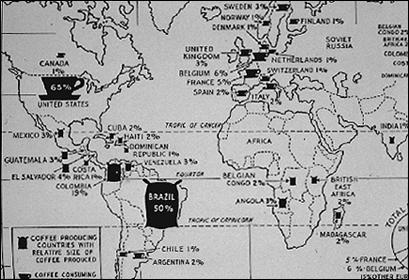
Geometric: high level of abstraction (do not have close
correspondence to a specific geographic feature), thus can be used to represent
arbitrary geographic features, can be read correctly even when very small
(doesn’t take much space in the map), have to refer back to the legend
e.g. European crude oil reserve map
Generalization on qualitative thematic maps
1) Location
The point corresponds to
either physical location or representative location
e.g. horizontal survey control points (benchmark) in a
large-scale map
e.g. cities in a small-scale map
2) Dimensionality
Line features on the ground
may have a width, but they are mapped as if they were one-dimensional lines;
for example, road has width or even depth, but it is usually treated as a line.
Tornado can be better seen as a volume (3 dimensional), but is commonly treated
as a path (1 dimensional)
3) Homogeneity in type within
a spatial unit
Soil class within a
categorical boundary is assumed to be homogeneous even though they can be
mixed. Road surface type is assumed to be homogeneous within a road
segment
This kind of generalization
is prominent in qualitative thematic maps due to the nature of measurement
level.
Generalization (a kind of
cartographic abstraction) has an implication for map accuracy
Road surface type for
traveler
Water level for navigator
Map purposes determine an
appropriate level of generalization.
Dimensionality
Point-Feature Qualitative
Thematic Maps
Shows zero-dimensional entity
(without width or area) defined solely by its geographic location.
The point feature can be
either physical location or just approximation of location
Figure 6.3
Line-Feature Qualitative
Thematic Maps
Shows types of
one-dimensional features having length and direction but no width
Types on line features are
mapped as if they were one-dimensional lines
e.g. road class map, road surface type map
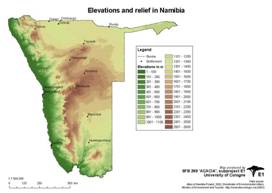
Area-Feature Qualitative
Thematic Maps
A region is divided into
two-dimensional data collection areas defined by the qualitative features
within their boundaries
The categories is mapped as
if it were homogeneous within the data collection area, with no internal
variation
Figure 6.4
Two different kinds of data collection area in
area-feature maps
Compare Figure 6.4
(presidential candidate vote) and Figure 6.5 (major aquifer)
How are the data collection
areas determined respectively? (Nature of boundary)
Which boundary is more
natural, which is rather arbitrary?
All are called categorical
map by convention.
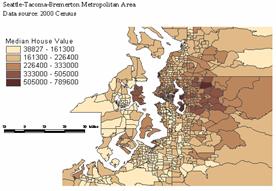
Choropleth map: quantitative thematic map on enumeration areal unit (e.g. census unit)
Dasymetric map: quantitative thematic map on homogeneous
boundary
Since it’s hard to determine
natural boundary as a unit to report on population distribution
Different mapping processes
are involved
Which map do you think is better
way to show variations in attribute?
Others
Maps can show more than one
theme → multivariate map
Usually when themes are
related
Figure 6.7: useful in seeing
if there any geographical relationship between bottom type and the harvest of
shellfish
Temporal elements can be
introduced to the map → change map, animated map
Time is not fixed any more
Can show change between time
periods (see Figure 6.9)
Can show movement of features
(see Figure 6.11)
Review questions
Look at this map, and answer
questions
1. Is it reference map or thematic map?
2. Is it qualitative or quantitative?
3. Is it continuous or discrete?
4. Dimensionality of symbol?
5. Is the location of the symbol real?
6. What is the data collection area? Is it arbitrary or
somewhat natural?
7. Is it univariate or
multivariate?
8. Is the symbol pictographic or geometric?
9. Suggest other ways to make map from the same data