Geog 258: Maps and GIS
January 6, 2006 (Fri)
Introduction to the map
Map is a Model of Reality
Example: Shaded Relief Map of
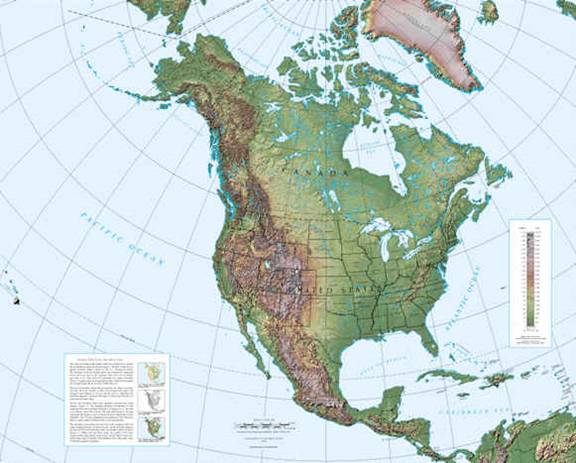
Source: National Atlas of
Let’s compare between the map
above and the reality mapped
Focus on how topography is
*represented* in this map
1) The size of map vs. that
of topography in
2) The dimension of map vs.
that of topography in
3) The coding scheme of map
vs. that of topography in
What Constitutes Mapness?
- Defining Characteristics of
Maps -
1. Map Scale
Map is the reduced version of reality
The scale bar shows the
proportion of the map to the environment mapped
![]() ←
graphic bar scale
←
graphic bar scale
Also look at maps in mapquest
along different scale. What do you see is changing?
What can you infer about the
relationship between map symbols and scale?
Symbolization is dependent
upon scale
Pointer to reading: Chapter 2
2. Map Projection
Map is the flattened version of spherical earth
surface
Map projection means the
transformation from 3D to 2D
Human beings are not
conscious of spherical earth as the geographic scale we can directly experience
is confined to very small portion of earth surface
![]()

Any change in this
transformation as shown above?
We use different spatial
reference systems to make sense of the location of features (e.g. from street
address, place name, region to latitude & longitude)
Pointer to reading: Chapter
1, 3, 4, and 5
3. Map Abstraction
Map is the abstracted version of reality
It is necessary to abstract
reality to well-accepted coding scheme
Usually cartographic
abstraction involves four processes
1) Selection: you can’t show every detail in map, but rather
some important detail should be selected (e.g. tourist map should contain
leisure activities)

Source: Old map gallery
2) Classification: some values are classified into a
bundle of values (e.g. per capita income
by census tract will be represented with five grading tones instead of the
whole range of income value)
Data
source: 2000 Census Summary File 3
3) Simplification: symbols need to be simplified
depending on scale (e.g. does
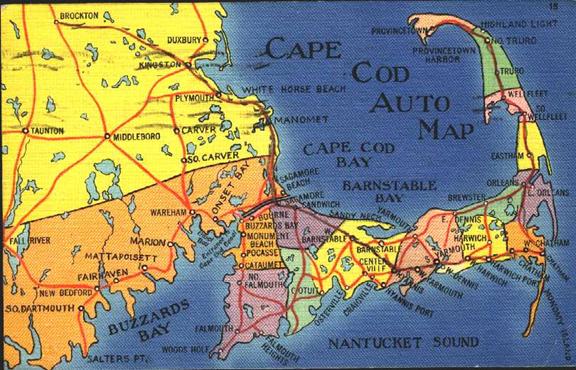
Image source: www.geocities.com/jqsfamily/postcards/cape.html
1) Symbolization: features should be symbolized properly on
the basis of inherent connotation of symbol (e.g. Red China, Blue/Red for
political affiliation) or well-accepted standards (e.g. hypsometric tint)
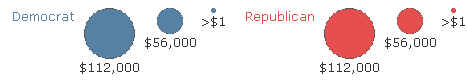
Source: Fund Race 2004
More on map abstraction next
week
In technical terms, the
shaded relief map is a small-scale map (scale), employs Equal-Area Albers Conic
(projection) and elevation is represented with hypsometric tint (abstraction).
At the end of this course, you should be able to specify three components of
any maps given.
“Mapness” Continuum
See Figure I.3 in the text
(p. 6)
Different types of maps lie
along a “mapness” continuum (i.e. the degree of closeness to reality or level of
abstraction) depending on varying degrees of defining characteristics
For example, same phenomenon
(e.g. elevation) can be represented differently such as
1) Air Photo: it’s just the
photo image of earth surface (i.e. less abstraction)
2) Orthophotograph: it’s
rectified and georeferenced image of earth surface
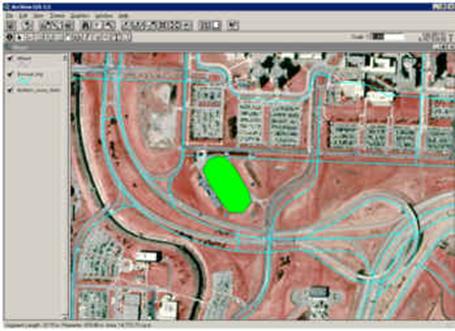
Southern tip of SUNY-Buffalo North Campus
Source data: NY GIS clearing house - orthophoto
3) Topographic map: elevation
is represented by contour line (we usually set up some agreement on reading
contour line), highway is labeled with shield (i.e. more abstraction)
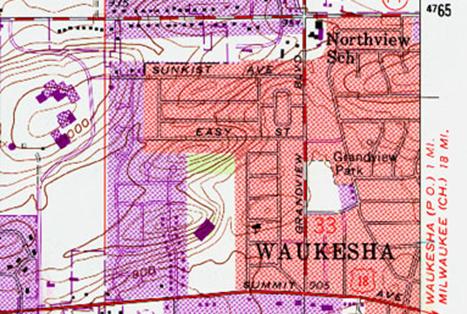
Source:
USGS DRG (Digital Raster Graph)
Image map is close to pure
reality, topographic map gets farther from reality through map abstraction
Map Use vs. Map Making
It’s useful to make a
distinction between map use and map making.
The figure below shows map
use on the left and map making process on the right
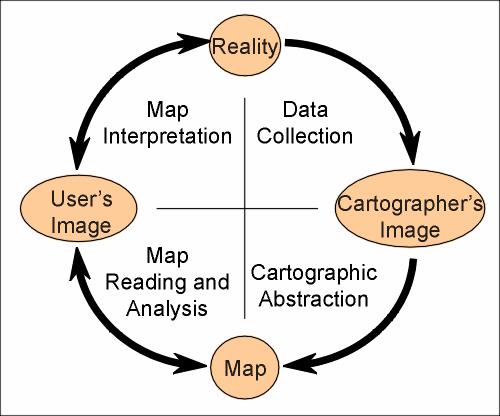
But there are close
relationship between map use and map making
Effective use of maps requires
understanding of the nature of maps and the mapping process while good map
design requires understanding of how the maps will be used. The communications
model also serves to emphasize that map use is not simply the reverse of map
making but requires a distinct set of skills.
Mental Maps
Even though maps refer to
cartographic maps most of the time, mental maps are noteworthy in our map
class, because most of our geographic decision is based on our internalized
representation of spatial knowledge (that is mental maps)
If you’re having a hard time
in visualizing mental maps, imagine what happens in your mind when you try to
find the route from home to school or get lost. Yes, you have your own maps of
areas (or image of space) in your mind. If you’re asked to construct a map
without surveying equipment or knowledge of GIS and mappable data, you probably
end up creating mental maps, which is quite unlikely to be fair representation
of reality.
See Figure I.1 (p. 3)
How many of you wore a smile
when you saw this map out of sympathy?
Some facts about mental maps
Mental maps is personalized
view of the world
1) Mental maps reflect egocentric view of the world (see
Figure I.2)
2) Mental maps lack geometric accuracy of geographic
framework
Mental maps are formed
through firsthand/second experience
3) Mental maps are formed through direct experience (e.g.
wayfinding)
4) Mental maps can be influenced by indirect experience
a. It can improve the accuracy of your mental map (e.g.
map reading)
b. It can form the image of some areas you have never
been to
We use mental maps all the
time – when you find the route, when you try to answer “where am I”, when you
imagine cities where your friends live
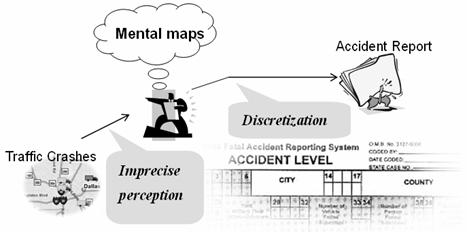
Police officer relies on his own
mental maps to pinpoint the location of accidents in accident report
Mental maps are important
because many geographic decisions are based on mental maps
Further discussion on mental
maps
How mental maps have been
used
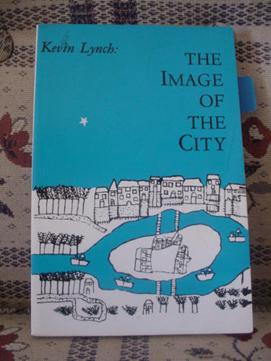
1) Can be used to design city
Kevin Lynch in his book “The Image
of the City” used mental maps to find out what makes cities have more comfort
level by asking residents directions. Residents or new comers have a hard time
answering questions in some urban settings characterized by lack of regular
geometry, landmarks and so on.
Kevin Lynch claims that urban
setting is the composition of nodes, landmarks, paths, and districts. Some
cities have higher comfort level because new comers can be more oriented. We
can use this information to design cities.
2) Can be used to understand
how human beings acquire spatial knowledge:
Reginald Golledge theoriezes
that human beings acquire spatial knowledge in the order of landmark
(0-dimension, point), route (1-dimension,line, spatial relation) and survey
knowledge (2-dimension, area, absolute reference framework). Jumping from
landmark/route knowledge to survey knowledge requires indirect experience such
as reading cartographic maps.
Golledge, R., Dougherty, V.
& Bell, S. (1995). Acquiring spatial knowledge: Survey versus route-based
knowledge in unfamiliar environments. Annals of the Association of American
Geographers, 85 (1), 134-158
3) Can be used to
infer/predict taste or preference
Peter Gould surveyed geography
students in his class where they want to move to after they graduate.
What Makes Maps Popular?
1) Convenience: portable (paper map) and accessible (web
map)
2) Simplicity: you don’t have be overwhelmed by
complexity
3) Credibility: because it seems to be the close
representation of the environment
4) Visual impact: it becomes a tenacious memory
These features can be seen as
limitations
Perversion of reality is inherent
in mapping; map is like a frozen food/controlled fiction
Most of maps are static
(doesn’t reflect change)
Having a strong visual
impression doesn’t mean it’s meaningful
In some sense, this course is
to make you less tricked by the map
Look beyond the map and
confront the world
How Maps Are Used?
- Functions of Maps -
Reference maps: written
accounts of the locations of different features
e.g. university district map
allows you to identify locations of features and spatial relation between them
Figure I.4
Thematic maps: functions like
an essay on a particular topic
e.g. housing value map in
university district and bus route map in university district allows you to be
informed of particular subjects
Figure I.5
Navigation maps: maps created
specifically to help navigation
Figure I.6
e.g. topographic map,
nautical charts, aeronautical charts
Persuasive maps: sort of
propaganda tools
Figure I.7, I.8, I.9
Further reading: How to lie
with maps by Monmonier
Different Levels of Map Use
See Figure I.11
Map reading: understand what
map makers portray, and how they are represented
e.g. read Title, legend,
scale, map projection, coordinate system, data source, symbol, class interval
Map analysis: make
measurements and look for spatial patterns
e.g. regional clustering of
cancer mortality rate in eastern
Map interpretation: explain
measurements and spatial patterns
e.g. why regional clustering
there?
Why study mapping process?
Map is a lie which makes us
realize the truth
To understand a map, you need
to know how maps are made, especially distorting aspects of the mapping process
Be careful not to confuse the
mapped world with the real world
Why use maps?
Appreciation of maps leads to
a better understanding of the world around you
Relevancy to GIS
Maps are made in GIS
Maps are common input of GIS
Maps are common output of GIS
Maps are important
representation framework of GIS data
Review questions
1. What are defining
characteristics of maps?
2. Compare and contrast
1) Mental maps versus
Cartographic maps
2) Reference maps versus
Thematic maps
3. Author says that
representing surroundings with maps can be deceptive, in what sense?
What are advantages in using
maps for understanding surroundings?
What are dangers in using
maps for understanding surroundings?