Geog 495: GIS Database Design
10/17/05
Unified Modeling Language (UML)
This week
Mon: OO concepts revisited (reading: RC11)
Tue: UML overview (reading: OMG 2003)
Wed: Class diagram (reading: Fowler 1999)
Thurs: Lab on UML with Visio
Fri: Lab continued; project proposal due
[OMG 2003] UML Superstructure from OMG website
Fowler and Scott 1999, UML Distilled (second edition), a brief guide to the standard object modeling language
More details on Object-Oriented Data Model
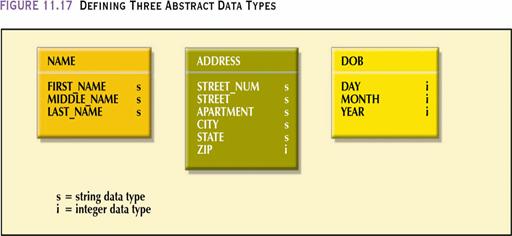
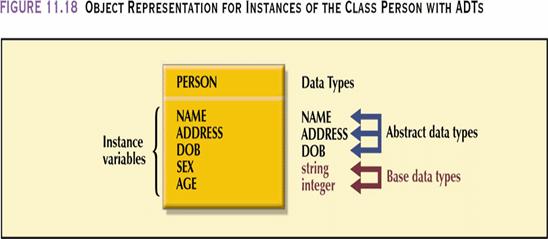
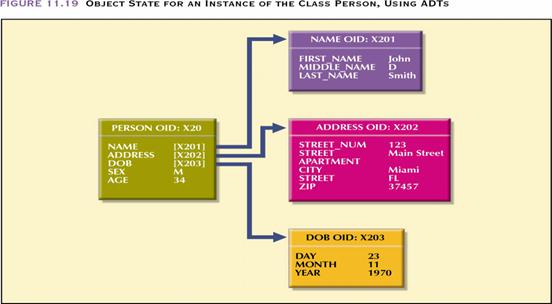
Abstract Data Types
Allows for “user-defined” data types
Promotes modularity
Representing relationships
in OODM
Business rules:
Employees works at only one Facility
One employee is a manager of Facility
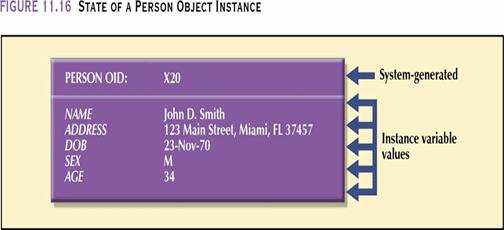
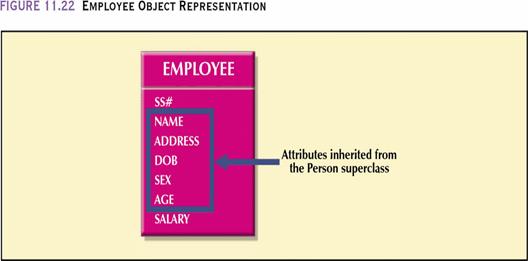
EMPLOYEE (SS#, NAME, ADDRESS, DOB, SEX, AGE, SALARY)
FACILITY (CODE, NAME, ADDRESS, BUDGET)
How are they represented in ERD?
How are they represented in OODM?
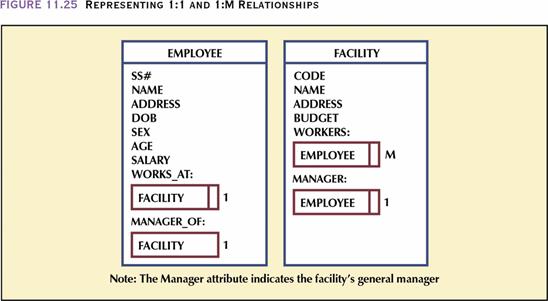
Descriptions of notations used in OO conceptual representation
(1) Related classes are enclosed in boxes to make relationships more noticeable
(2) The double line on the box’s right side indicates that the relationship is mandatory
(3) Connectivity is indicated by labeling each box (e.g. each employee works at only one facility)
(4) Write the name of relationship above the box containing related class, followed by colon (e.g. employee is manager of facility)
This diagram illustrates several differences in OODM
(1) relationship is not built by common attributes, but by reference to object; relationships are included in the object
(2) operations embedded in classes can reference other classes (e.g. facility class can return the value of the number of workers in facility by triggering method called say workers which include the reference to employee)
Note: this is not UML
Comparison between
OODM and ERDM
(1) ID
(2) Relationship
(3) Data type
(4) Operation
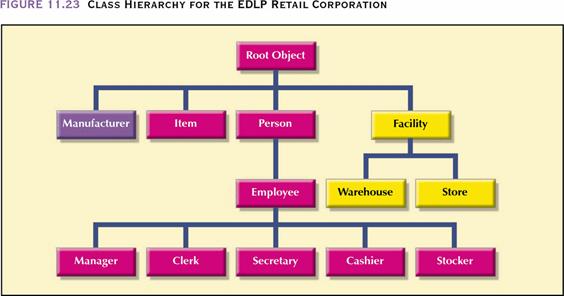
(5) Class hierarchy
The OO data model allows the designer to create a more authentic representation of real-world objects
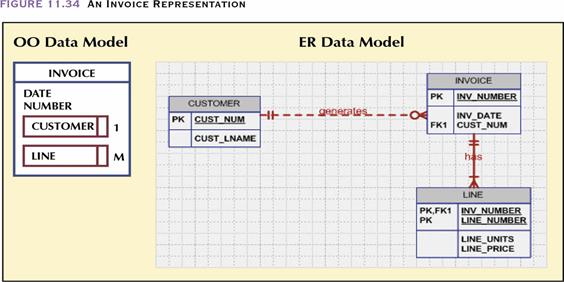
Lab
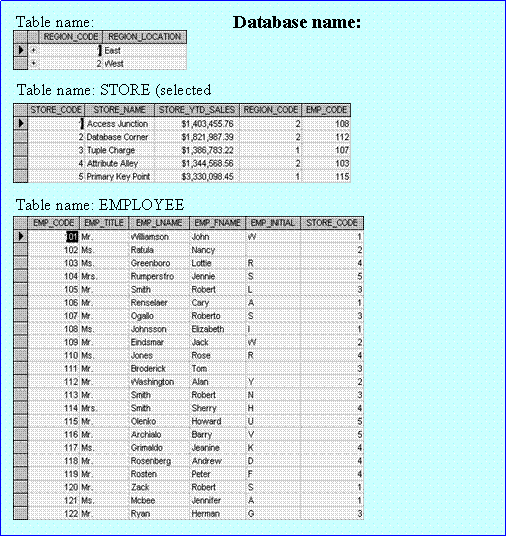
Convert the following relational database
tables to the equivalent OO conceptual representation. Explain each of your conversions with the
help of a diagram.
Geog 495: GIS Database Design
10/18/05
Unified Modeling Language (UML): Overview
Why UML?
The importance of modeling


Challenge: Shanty town Vision: Fallingwater
Figure source: Cris Kobryn 1999
Hard to imagine building skyscrapers without blueprints. There were no conventions that were universally accepted for describing software. Need for increasing the ease of understanding an application under development
UML attempts to provide graphical language that allows system designers in the worldwide to communicate to each other.
What is UML?
Standardized notation for object-oriented analysis and design
Standard language for specifying, visualizing, constructing, and documenting all the artifacts of software systems, as well as for business modeling and other non-software systems -- OMG UML Notation Guide
UML is modeling language: Why do we model?
Good models are essential for communication among project
teams and to assure architectural soundness. As the complexity of systems
increase, so does the importance of good modeling techniques. Having a rigorous
modeling language standard is one essential factor for the success of
project.
UML is graphic language: Why do we model
graphically?
The UML use graphic notations to express the design of software projects.
Natural language is too imprecise; Programming language is too precise; so I use UML when I want a certain amount of precision but I don’t want to get lost in details (Fowler 1999).
It helps project teams communicate, explore potential designs, and validate the architectural design of the software. It’s like blueprints for building software system
That’s blueprints plural, because different workers need different views of what they’re trying to build - you need to have multiple plans. That is the reason why UML provides different diagrams.
When do you use UML?
UML can be used in all facets of system developments.
When building an object-oriented system, you can use UML to analyze users’ requirement (business modeler), design databases (database designer), write component code (programmer), and acquire an overall view of the system (project manager, customer, CEO). Different types of UML diagrams allows for looking at projects from different perspectives.
UML Goals
- Define an easy-to-earn but semantically rich visual modeling language
- Well-formedness rules: a model adheres to all semantic and syntactic rules that apply to it
- Unify the Booch, OMT, and Objectory modeling language and others
- Furnish extensibility and specialization mechanisms to extend the core concepts
- Stereotype, tagged value, constraints
- Support specifications independent of particular programming languages
- Support higher-level development concepts such as components, collaborations, frameworks and patterns
- Integrate best practices
- Enable model interchange and define repository interfaces
- XMI (XML Metadata Interchange)
Building blocks of
UML
- Model elements (class, interface, component, use cases, etc)
- Relationships (associations, generalization, dependency, etc)
- Diagrams (class diagram, use case diagram, interaction diagram, etc)
Types of UML Diagrams
Each UML diagram is designed to let developers and customers view a software system from a different perspective and in varying degrees of abstraction.
Three different kinds of diagram
- Behavior Diagrams
Describes behavioral aspects of system
- Use case diagram
- Activity diagram
- Structure Diagrams
Shows the static structures of the model; do not show temporal information
- Static structural diagrams: class diagram, object diagram
- Implementation diagrams: package diagram, component diagram deployment diagram
- Interaction Diagrams
Represent different aspects of interactions; derived from behavior diagrams
- Sequence diagram
- Collaboration diagram
UML Diagrams
Illustrated
Source of figures below: Terri
Quatrani, 2003, Introduction to the UML, Rational Developer Network, retrieved
from http://www.rational.net
Activity Diagrams
Describes the workflow of a system
composed of action state (rounded rectangle) and transition (arrow)
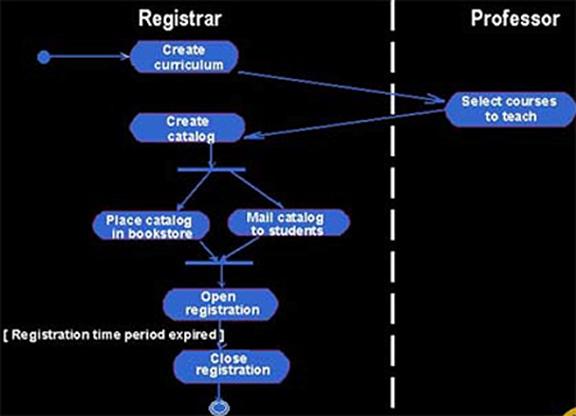
Swimlanes show the ownerships of controls (i.e. who’s responsible for which activity?)
Shows internal (i.e. within the system) processing
Use Case Diagrams
A set of scenarios that describes an interaction between a user and a system
Displays the relationship among actors (stick figure) and use cases (oval)
Show what is outside (actor) and the functionality that the system must provide (use case)
Good for deriving requirements of the system
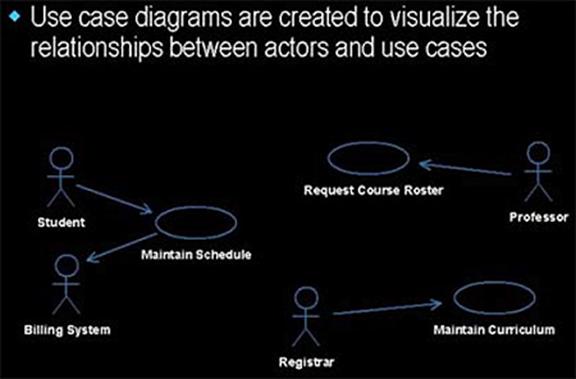
There are three different ways in which use case can be realized: (1) sequence diagram (2) collaboration diagram (3) class diagram
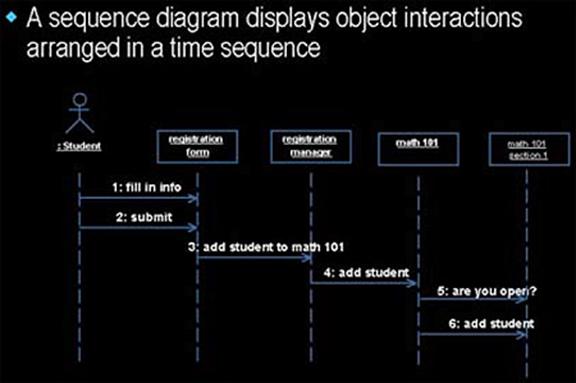
Sequence Diagram
Shows object interactions arranged in a time sequence
Useful for deriving user interface requirement
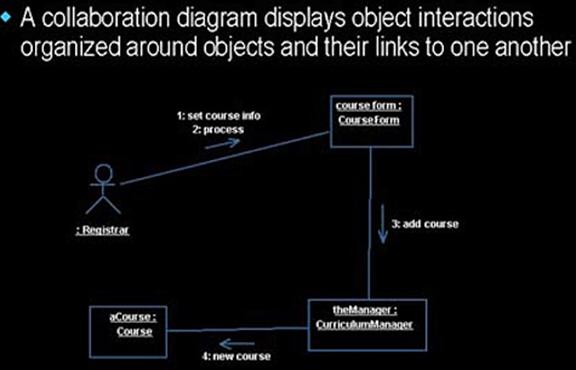
Collaboration Diagram
Scenario is viewed on the basis of links between the objects
Good to observe how messages are sent between the objects
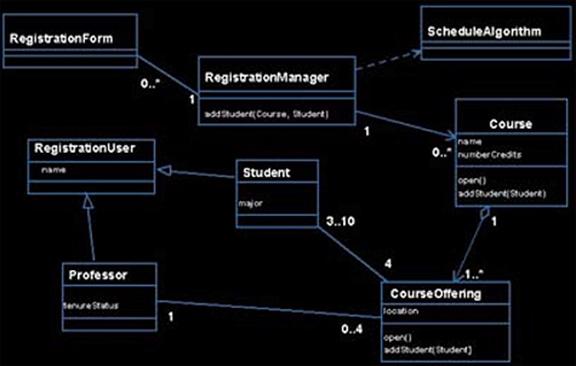
Class Diagram
Shows static structure of objects and relationships used in the system under development
Model class structure (attribute) and behavior (operation)
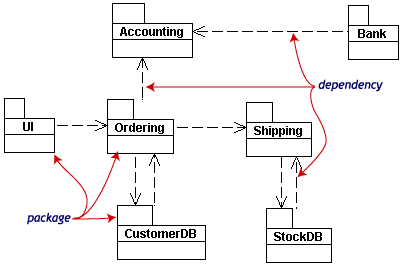
Package Diagram
Classes can be grouped into packages so that complex class diagrams may be simplified.
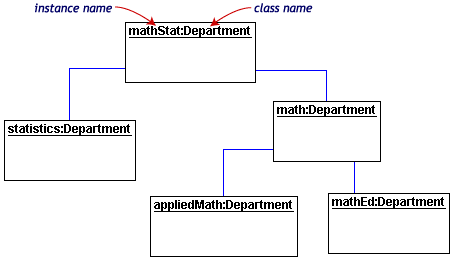
Object Diagram
Shows instances instead of classes
The following two diagrams are also called Physical Diagram because it deals with physical implementation of a system
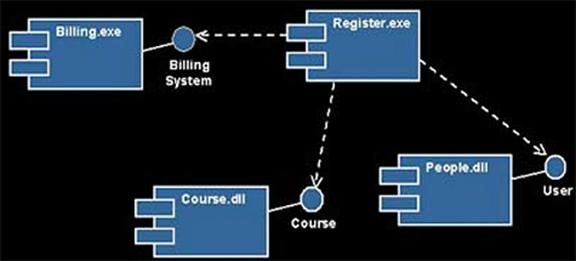
Component Diagram
Shows how software components are organized and dependent on one another
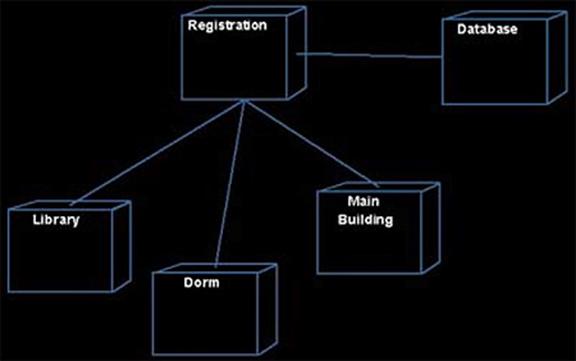
Deployment Diagram
Visualizes the distribution of components across the enterprise
Q.
Who is most likely to use which diagram? or when?
Use case diagram, class diagram, component diagram…
Extending UML
UML can’t satisfy all of system designers’ needs
UML is meant to be extended to any particular system
The following provides a mechanism that allows for extending UML
- Stereotype: additional modeling constructs
- Tagged value: additional properties
- Constraints: additional constraints
that conform to a rather rigid specification that is not modeled in UML
This is how you can create custom (user-defined) features
Geog 495: GIS Database Design
10/19/05
Unified Modeling Language (UML): Class Diagram
Notation
Three stacks (where they go?, naming scheme)
Name
Attributes
Operations
Relationships {what it is?, how it is denoted?}
Association
Generalization
Aggregation
Composition
Dependency
Multiplicity
1
*
0…*
1…*
Navigability
Uni-directional
Bi-directional
Visibility
Public
Private
Protected